الوصف
PnL Studio
حوّل سجل تداولاتك في cTrader إلى لوحة أداء بصرية وشاهد فوراً أنماط التداول ونقاط القوة ومجالات التحسين.
PnL Studio هو إضافة تحليلية قوية تحول سجل تداولاتك إلى لوحة عرض بصرية واضحة. بدلاً من التمرير عبر قوائم طويلة من التداولات، يمكنك بسرعة فهم أداء تداولاتك عبر الأيام والأسابيع والاستراتيجيات.
مع تتبع الأداء المعتمد على التقويم، والإحصائيات الرئيسية، وأدوات فحص التداولات التفصيلية، يساعد PnL Studio المتداولين على تحليل النتائج وتحديد الأنماط التي يمكن أن تحسن اتخاذ القرار.
الميزات الرئيسية
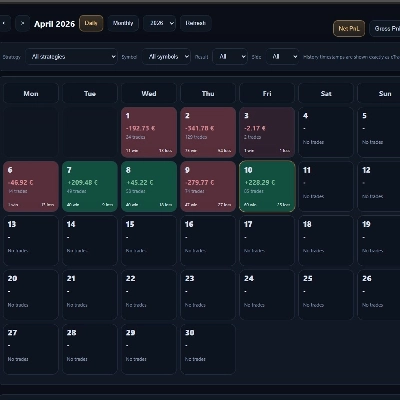
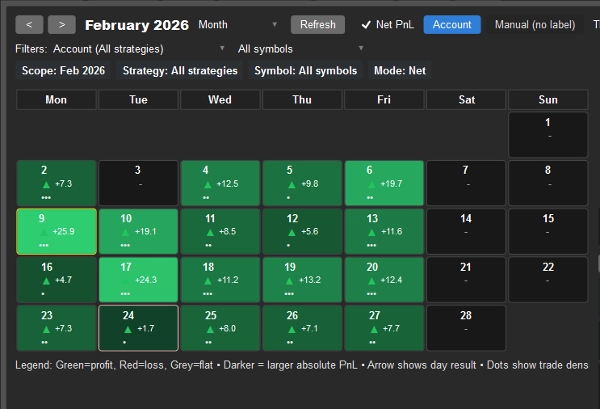
تقويم أداء التداول البصري
شاهد فوراً كيف كان أداء كل يوم تداول من خلال خريطة حرارة ملونة للتقويم.
• أخضر = أيام مربحة
• أحمر = أيام خاسرة
• الألوان الداكنة = ربح أو خسارة أكبر
• مؤشرات النشاط تظهر شدة التداول
• الأسهم الاتجاهية تبرز الأيام الرابحة أو الخاسرة
انقر على أي يوم للتعمق في التداولات التي أدت إلى تلك النتيجة.
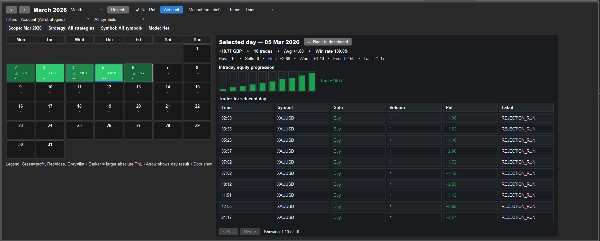
مراجعة التداول يومًا بيوم
اختر أي يوم من التقويم لفحص التداولات الدقيقة وراء النتيجة.
عرض:
• قائمة التداولات مع الرمز، الاتجاه، الحجم والربح/الخسارة
• تسمية الاستراتيجية لكل تداول
• تطور حقوق الملكية داخل اليوم
• إحصائيات اليوم بما في ذلك أفضل تداول، أسوأ تداول ونسبة الفوز
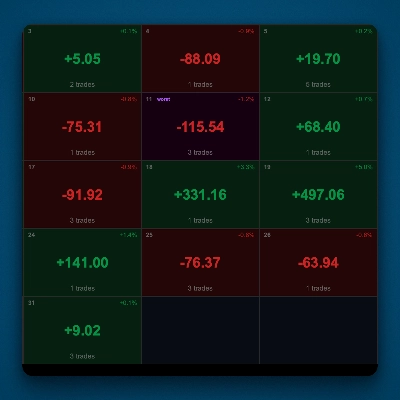
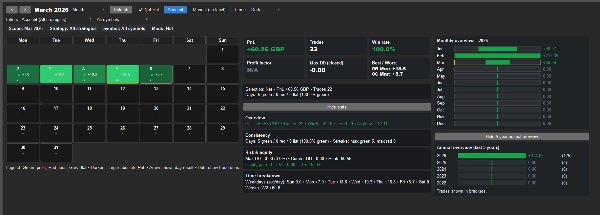
لوحة أداء شهرية
افهم بسرعة أداء تداولاتك الشهري مع المقاييس الرئيسية بما في ذلك:
• إجمالي الربح/الخسارة
• عدد التداولات
• نسبة الفوز
• عامل الربح
• أقصى تراجع مغلق
• أفضل وأسوأ أيام التداول
تصفية الاستراتيجية والرمز
حلل استراتيجيات أو أسواق محددة باستخدام فلاتر مرنة.
صفِّ النتائج حسب:
• تسمية الاستراتيجية
• الرمز
• الربح/الخسارة الإجمالي أو الصافي
• نطاق الوقت (شهر أو سنة)
نظرة عامة على أداء الاستراتيجية
يلخص النتائج تلقائيًا لكل تسمية استراتيجية حتى تتمكن من مقارنة الأداء بسرعة.
يشمل:
• الربح الإجمالي
• متوسط نتيجة التداول
• عدد التداولات
• تصنيف قوة الاستراتيجية
رؤى الأداء على المدى الطويل
تتبع الاتساق مع مرور الوقت من خلال ملخصات مدمجة تشمل:
• نظرة عامة شهرية للسنة الحالية
• تحليل الأداء السنوي لخمس سنوات
مصمم للمتداولين الذين يرغبون في فهم أعمق
سواء كنت تتداول يدويًا أو تستخدم استراتيجيات آلية، يساعدك PnL Studio على فهم كيفية أداء تداولاتك مع مرور الوقت.
استخدمه لـ:
• تحديد أيام التداول المربحة
• اكتشاف أنماط الأداء
• تحليل سلوك الاستراتيجية
• مراقبة اتساق التداول
يعمل جنبًا إلى جنب مع أدوات AWTrades الأخرى:
PnL Studio هو جزء من مجموعة أدوات AWTrades الأوسع المصممة لمساعدة المتداولين على فهم كل من الأداء والمخاطر بشكل أوضح.
يمكنك دمجه مع:
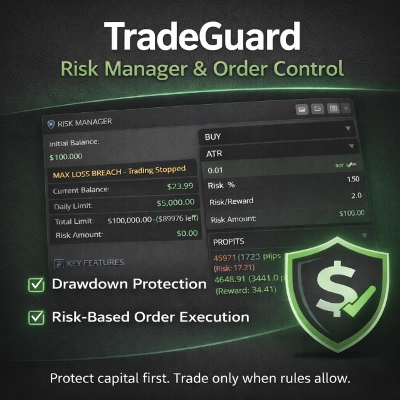
• Risk Watch – إضافة مراقبة المخاطر الحية التي تعرض التعرض الحالي، أسوأ المخاطر المحتملة وتركيز المراكز المفتوحة عبر حسابك.
• Trade Analytics – لوحة متقدمة تقيم جودة الحافة الإحصائية لتداولاتك، بما في ذلك التوقع، الاتساق وتركيز الأرباح.
معًا تخلق هذه الأدوات سير عمل تداول أكثر تكاملاً:
PnL Studio – مراجعة الأداء البصرية
Risk Watch – مراقبة المخاطر والتعرض الحية
Trade Analytics – تحليل جودة الحافة والمتانة
بسيط وخفيف الوزن
يعمل PnL Studio مباشرة داخل cTrader ولا يتطلب أي برامج خارجية.
فقط افتح علامة تبويب PnL Studio لتصور وتحليل أداء تداولاتك فورًا.
الملخص
تقييمات العملاء
5 | 33 % | |
4 | 67 % | |
3 | 0 % | |
2 | 0 % | |
1 | 0 % |