الوصف
ملف حجم التأرجح (SVP)
ملف حجم قائم على التأرجح + فيبوناتشي + مؤشر القوة النسبية
--------------------------------------------------
كشف التأرجح. ملف الحجم. فيبوناتشي. مؤشر القوة النسبية. الكل في واحد.
--------------------------------------------------
ما الذي يفعله هذا المؤشر
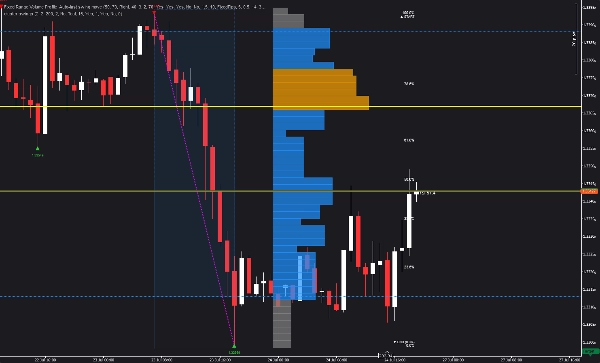
يقوم ملف حجم التأرجح (SVP) بالكشف التلقائي عن التأرجحات الهيكلية ويعرض ملف حجم لأحدث تأرجح مكتمل — مع تراكب فيبوناتشي ومؤشر القوة النسبية.
لا حاجة لاختيار النطاق يدويًا. يجد المؤشر التأرجحات ويبني الملف تلقائيًا.
--------------------------------------------------
الميزات الرئيسية
- الكشف التلقائي عن التأرجح (عمق وانحراف قابلان للتكوين)
- ملف الحجم لأحدث تأرجح مكتمل
- نقطة التحكم (POC) - أعلى مستوى حجم
- منطقة القيمة (VAH + VAL) - نسبة مئوية قابلة للتكوين
- عقد حجم عالية (HVN) - حجم فوق عتبة المتوسط
- تصحيح فيبوناتشي (0، 23.6، 38.2، 50، 61.8، 78.6، 100)
- تراكب مؤشر القوة النسبية بالقرب من السعر الحالي
- تموضع المدرج التكراري: يسار، يمين، أو بالقرب من الأعمدة
- صفوف قابلة للتكوين (10 إلى 200)
- ألوان وشفافية قابلة للتخصيص
- تمديد الخطوط إلى اليمين
- إظهار/إخفاء تسميات الأسعار
- لا يعيد الرسم
--------------------------------------------------
كيف يعمل
1. يكتشف المؤشر التأرجحات باستخدام عمق وانحراف قابلين للتكوين
2. يتم تحديد آخر تأرجح مكتمل
3. يتم حساب ملف الحجم من نطاق التأرجح
4. يتم عرض POC، VAH، VAL، HVN
5. يتم تراكب تصحيح فيبوناتشي على التأرجح
6. يتم عرض مؤشر القوة النسبية الحالي بالقرب من السعر
كل شيء تلقائي. لا حاجة لإدخال يدوي.
--------------------------------------------------
العناصر المرئية
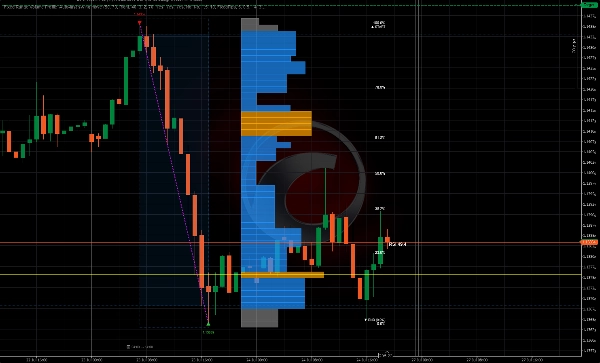
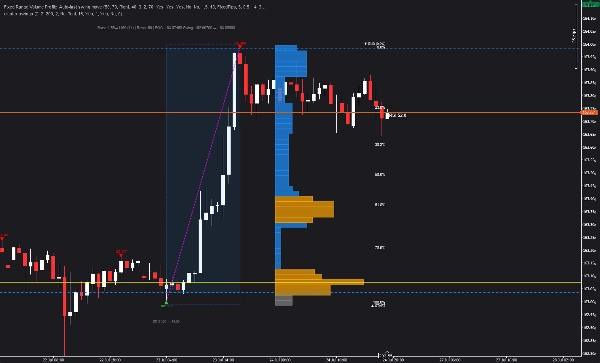
- مثلثات حمراء للأسفل = قمم التأرجح
- مثلثات خضراء للأعلى = قيعان التأرجح
- خط منقط أرجواني = اتصال التأرجح
- خط أفقي أصفر = نقطة التحكم (POC)
- خطوط زرقاء متقطعة = أعلى منطقة قيمة (VAH) وأدنى منطقة قيمة (VAL)
- أعمدة برتقالية = عقد حجم عالية (HVN)
- أعمدة رمادية = عقد حجم منخفضة
- خطوط أفقية ذهبية = مستويات فيبوناتشي
- تسميات بيضاء = نسب فيبوناتشي المئوية
- قيمة مؤشر القوة النسبية = مؤشر القوة النسبية الحالي بالقرب من السعر
--------------------------------------------------
نظرة عامة على المعلمات
إعدادات الملف:
- عدد الصفوف: عدد صفوف السعر (10-200)
- نسبة منطقة القيمة: % من الحجم في منطقة القيمة (1-100)
الإعدادات المرئية:
- موضع المدرج التكراري: يمين، يسار، بالقرب من الأعمدة، أو بالقرب من الأعمدة على اليسار
- عرض المدرج التكراري %: عرض أعمدة المدرج التكراري
- مقياس عرض العمود: عامل مقياس لعرض الأعمدة
- الحد الأدنى لعرض العمود %: الحد الأدنى لعرض العمود
- شفافية الأعمدة: شفافية الأعمدة (10-100)
كشف التأرجح:
- عمق التأرجح: عدد الأعمدة للتحقق من القمم والقيعان المحلية
- وضع الانحراف: نقاط ثابتة أو قائم على ATR
- الانحراف الثابت: الحد الأدنى لمسافة النقاط بين التأرجحات
- مضاعف انحراف ATR: مضاعف للانحراف القائم على ATR
- فترة ATR: فترة حساب ATR
- التراجع: الحد الأدنى للأعمدة بين التأرجحات
مرئي - التأرجحات:
- إظهار خطوط التأرجح: تبديل خط التأرجح الأرجواني
- لون خط التأرجح
- إظهار تسميات التأرجح: تبديل تسميات الأسعار
- ألوان التأرجحات العليا/الدنيا
مرئي - فيبوناتشي:
- إظهار تصحيح فيبوناتشي: تبديل التراكب فيبوناتشي
- إظهار خطوط فيبوناتشي: تبديل الخطوط الأفقية
- إظهار تسميات فيبوناتشي: تبديل تسميات النسبة المئوية
- لون خط فيبوناتشي / لون نص فيبوناتشي
مرئي - مؤشر القوة النسبية:
- إظهار قيمة مؤشر القوة النسبية: تبديل تراكب مؤشر القوة النسبية
- فترة مؤشر القوة النسبية: فترة حساب مؤشر القوة النسبية
- لون تسمية مؤشر القوة النسبية
الألوان:
- لون نقطة التحكم / لون منطقة القيمة / لون عقد الحجم العالية / لون الحجم المنخفض
--------------------------------------------------
حالات الاستخدام
- تحديد التأرجحات وتوزيع الحجم في عرض واحد
- إيجاد نقطة التحكم (POC) للدخول والخروج
- استخدام منطقة القيمة (VAH/VAL) لأهداف الربح
- تحديد عقد حجم عالية (HVN) للمستويات الرئيسية
- تطبيق تصحيح فيبوناتشي على التأرجح
- تأكيد الصفقات بتقاطع مؤشر القوة النسبية
- فهم توزيع الحجم بنظرة سريعة
--------------------------------------------------
الترقية إلى مناطق الحرارة الهيكلية
يعرض لك هذا المؤشر التأرجحات وتوزيع الحجم.
تأخذ مناطق الحرارة الهيكلية الأمر إلى أبعد من ذلك — فهي ترسم كثافة المشاركة، والقبول مقابل الرفض، والمشاركة السوقية عبر مناطق متعددة.
ابحث عن مناطق الحرارة الهيكلية في متجر cTrader.
--------------------------------------------------
الترقية إلى Invictus EA
يستخدم Invictus EA التكنولوجيا الهيكلية لتنفيذ الصفقات الآلية.
ابحث عن Invictus في متجر cTrader.
--------------------------------------------------
ملاحظات فنية
- مؤشر تراكبي
- يعمل على أي إطار زمني ورمز
- لا يعيد الرسم (حساب تاريخي)
- محسّن للأداء
--------------------------------------------------
الدعم
تحديثات مدى الحياة مشمولة.
لمزيد من المعلومات - انقر على ملف المطور أدناه.
الملخص
The indicator identifies swings using configurable parameters such as swing depth and deviation mode (fixed pips or ATR-based), then computes volume distribution within the swing range without requiring manual range selection. Visual elements include colored markers for swing highs and lows, volume nodes, Fibonacci levels, and RSI values, all customizable in terms of color, opacity, and histogram positioning.
Key features include no repainting, configurable rows for volume profile resolution, extendable lines, and toggleable price labels. Use cases focus on identifying swing structures, volume distribution, key price levels, and confluences for trade entries, exits, and profit targets. The indicator is optimized for performance and provides lifetime updates.