
설명
⚠️업데이트 완료, 진정한 심층 정보 즐기기⚠️
🔥 히트 맵 대시보드 📈
cTrader용 기관급 주문 흐름 및 모멘텀 터미널.
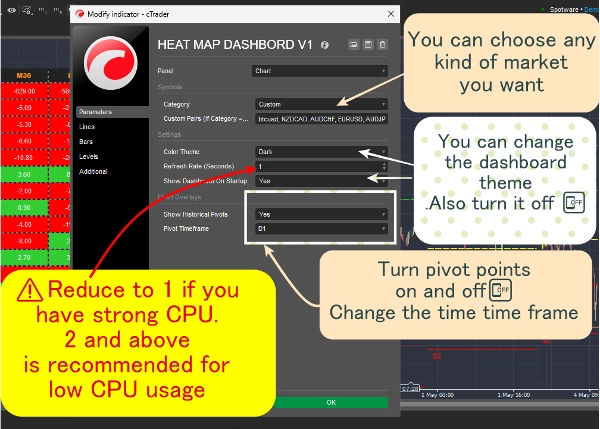
이 히트 맵 대시보드는 단순한 차트 오버레이가 아니라 플랫폼에 직접 내장된 세 부분으로 구성된 거래 생태계입니다. 시장 유동성, 실제 거래량 가중 평균, 거시적 추세를 "엑스레이"처럼 보여주며, 컴퓨터 속도를 늦추지 않습니다. ⚡
🎯 기능 소개 (트레이더 관점)
시스템은 거래를 세 가지 간단한 단계로 나눕니다:
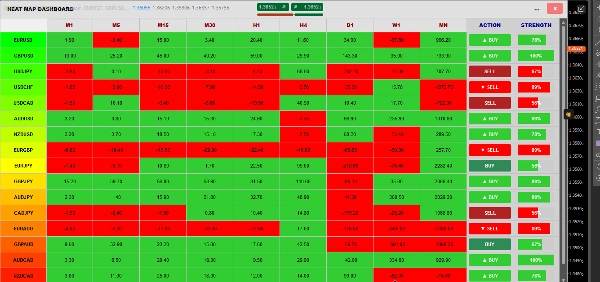
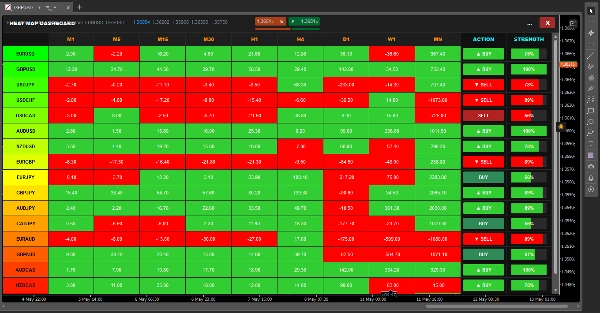
- 🎛️ 1단계: 무엇을 거래할지 (매트릭스). 수십 개의 차트를 클릭하는 대신, 대시보드는 9개의 시간대(M1부터 월간까지)에 걸쳐 17개의 다양한 자산을 스캔합니다. 각 셀의 모멘텀을 계산하고 색상으로 구분합니다. 한눈에 어떤 페어가 강력한 추세에 있고 거래 준비가 되었는지 알 수 있습니다.
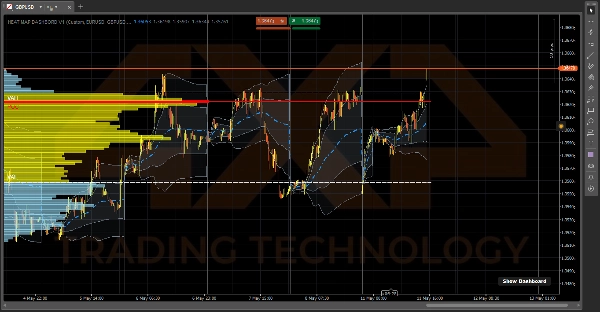
- 🌊 2단계: 누가 주도하는지 (VWAP). 페어를 선택하면 일간 기준 VWAP를 확인하세요. 이는 단순한 캔들스틱이 아닌 거래량을 기반으로 한 진정한 평균 가격을 보여줍니다. 음영 처리된 표준편차 구름은 동적 지지/저항 역할을 하며, 시장이 과매수 또는 과매도 상태임을 정확히 알려줍니다.
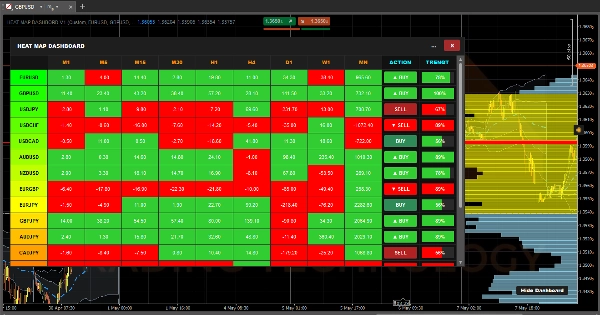
- 📊 3단계: 어디서 진입할지 (VRVP). 마지막으로, 가시 범위 거래량 프로필은 기관 유동성이 집중된 위치를 정확히 표시합니다. 자동으로 POC(중심가격)와 70% 가치 영역(VAH & VAL) 선을 그려, 진입과 청산을 위한 정확한 수준을 제공합니다.
⚙️ 작동 원리 (내부 구조)
이 정도의 계산을 시도하는 대부분의 지표는 즉시 플랫폼을 멈추게 하고 cTrader를 100% CPU 사용률로 다운시킵니다. 이를 방지하기 위해, 히트 맵 대시보드는 세 개의 고도로 최적화된 독립 엔진이 동시에 작동합니다:
1. 대시보드 엔진 (2초 심장 박동) ⏱️ 153가지 조합(17페어 x 9시간대)을 매 가격 틱마다 계산하면 컴퓨터가 과열됩니다. 대신 이 엔진은 엄격한 2초 심장 박동 타이머로 작동합니다. 2초마다 14캔들 전 가격과 현재 가격을 비교해 셀을 녹색(양의 모멘텀) 또는 빨간색(음의 모멘텀)으로 칠합니다.
2. VRVP 엔진 (화면 리더) 🖥️ 수천 개의 과거 바를 불러오는 대신, 거래량 프로필은 동적 "뷰포트 리스너" 역할을 합니다. 차트를 확대하거나 스크롤할 때만 작동하며, 현재 화면에 보이는 캔들을 cTrader에 요청해 해당 바들의 정확한 거래량 중첩을 계산하고 70% 가치 영역을 즉시 다시 그립니다.
3. VWAP 엔진 (틱 누적기) 🧮 VWAP는 실시간 틱에서 계산되는 유일한 요소입니다. 그러나 속도를 유지하기 위해 가벼운 "누적 데이터 시리즈"를 사용합니다. 매초 전체 하루를 다시 계산하는 대신, 새 틱의 거래량을 백그라운드 총합에 더하고 자정이 되면 자동으로 초기화합니다.
4. 윈도우 매니저 (형태 변환기) 🪟 대시보드는 맞춤형 C# 크기 조정 로직으로 감싸져 있어 모니터를 실시간으로 감지합니다. 최대화 [ ] 또는 복원 [=] 버튼을 누르면, 표시기를 통해 Chart.Width와 Chart.Height를 실시간으로 읽어 화면에 완벽히 맞게 즉시 형태를 변환하며 무너지지 않습니다!
요약
1. Market Momentum Matrix: Scans 17 assets across 9 timeframes (from 1 minute to monthly), calculating and color-coding momentum to identify trending pairs quickly.
2. Daily Anchored Volume Weighted Average Price (VWAP): Displays true average prices weighted by volume, with dynamic standard deviation clouds indicating overbought or oversold conditions.
3. Visible Range Volume Profile (VRVP): Maps institutional liquidity by highlighting the Point of Control (POC) and 70% Value Area (VAH & VAL) within the visible chart range, aiding precise entry and exit levels.
The dashboard operates via four optimized engines: a 2-second heartbeat engine for momentum updates, a viewport-driven VRVP engine for volume profile recalculations, a tick-accumulating VWAP engine for real-time volume-weighted pricing, and a dynamic window manager that adjusts the interface to fit the chart size. This architecture ensures efficient performance and real-time responsiveness. The indicator supports visualization, signals (including trend strength, breakouts, and reversals), and filtering based on tick data, volume, and market structure analysis. It is tagged for aggressive trading, market structure, liquidity sweeps, support/resistance, and risk dashboard functionalities.
고객 리뷰
5 | 100 % | |
4 | 0 % | |
3 | 0 % | |
2 | 0 % | |
1 | 0 % |


