
説明
MACD Custom MTF (Multiple Time Frame) v1.1 は、クラシックなMACDの実績あるパワーと、マルチタイムフレーム分析の重要な優位性、そして現代的で直感的な視覚化を融合させた高度なツールです。精度、迅速な解釈、そして独自の戦略に合わせてツールをカスタマイズする能力を求める目の肥えたトレーダーのために設計されています。
バージョン1.1の新機能:
- 100%スムーズなビジュアル: 途切れた/不連続だったMACDラインを修正しました。トレンド変化時もラインは完全に連続しています。
- 視認性の向上: 買い/売りシグナルのドットサイズを大きくし、シグナルラインとヒストグラムを太くして非常に見やすくしました。ゼロラインは目の疲れを軽減するために薄くしました。
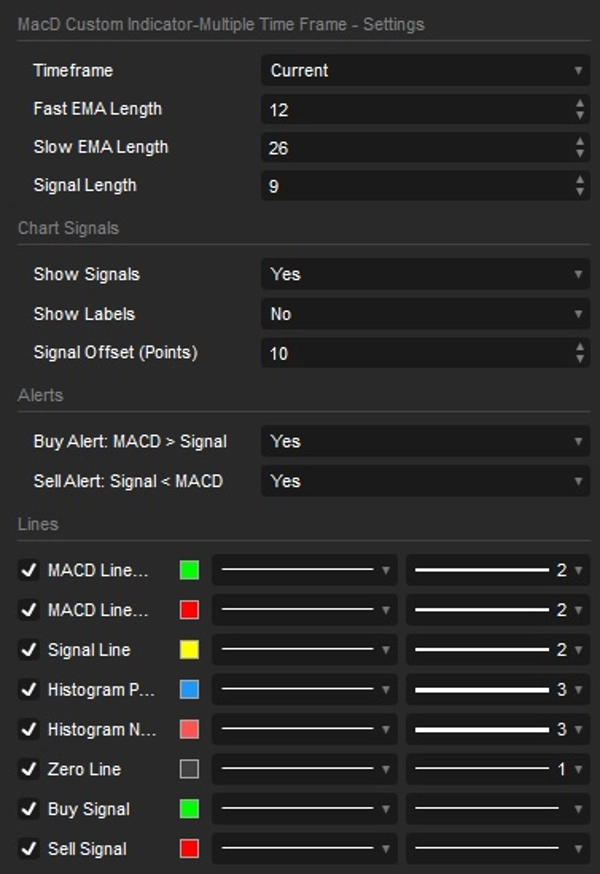
- スマートでシンプルなアラート: 設定ウィンドウを整理しました。「Buy Alert」または「Sell Alert」を切り替えるだけで、インジケーターが画面上のポップアップと正しいサウンド通知を自動的に処理します。
- 整理された設定: すべてのパラメーターが直感的なカテゴリに美しくグループ化され、ユーザー体験が大幅に向上しました。
- 完全な英語ローカライズ: すべてのログメッセージ、ポップアップ、エラーが完全に英語にローカライズされました。
単一チャート上でのマルチタイムフレーム(MTF)分析:
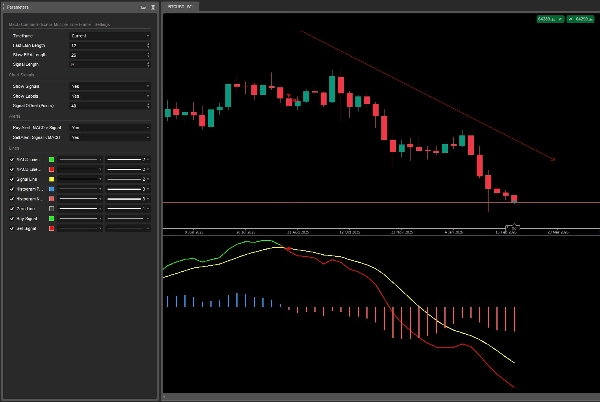
チャートの切り替えはもう不要です!上位時間軸(例:H1、H4、D1)のMACDデータを現在の作業チャート(例:M5、M15)に直接表示します。貴重な広範な市場コンテキストを得て、支配的な基調トレンドを特定し、下位時間軸からの誤解を招くノイズを効果的にフィルタリングします。完全に設定可能で、分単位から月単位までの包括的な時間軸リストから選択できます。
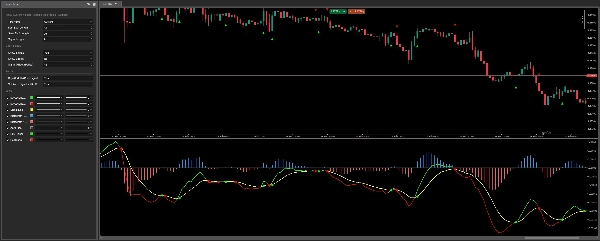
動的なMACD&シグナルラインのカラーリング:
瞬時のトレンド確認:MACDラインはシグナルラインをクロスすると動的に色が変わり、強気または弱気の勢いを鮮やかに示します。もう推測は不要です。ラインの色でMACDがシグナルの上(強気)か下(弱気)かがすぐにわかります。
クリスタルクリアなヒストグラム:
MACDとそのシグナルライン間のダイバージェンス(強さ)を簡単に視覚化します。インジケーターは太くしたバーを直感的に色分けし、正の値(青)か負の値(赤)かに基づいて勢いの変化を一目で深く理解できます。
明確なビジュアルクロスオーバーシグナル:
重要なクロスオーバーを見逃しません!インジケーターはMACD/シグナルラインの交差を自動的に強調表示します。価格チャート上に調整可能なオフセット付きで明確に見えるドットをプロットし、オプションで「Buy」「Sell」のテキストラベルも表示して究極の明瞭さを提供します。
統合されたスマートアラート:
買いと売りのシグナルに対する組み込みの手間いらずのポップアップとサウンド通知機能を備えています。画面に張り付くことなくすべてのチャンスを把握できます!設定でアラートを切り替えるだけで、インジケーターが監視を代行します。
指先でできる完全カスタマイズ:
- 高速EMA、低速EMA、シグナルラインの長さを正確に指定してカスタマイズできます。
- すべての設定は論理的なグループ(MACD設定、チャートシグナル、アラート)にきれいに整理されており、迅速な調整が可能です。
- 個々の視覚要素(MACD&シグナルライン、ヒストグラム、クロスオーバーシグナル、ラベル)の表示切替が可能です。
- チャートの美観や好みに完璧に合わせるための調整可能なシグナルオフセット。
概要
Key features include dynamic coloring of the MACD and signal lines to indicate bullish or bearish momentum, a crystal-clear histogram that visualizes the divergence between MACD and its signal line with color-coded bars, and unmistakable visual crossover signals marked by distinct dots or arrows on the price chart. The indicator supports integrated alerts with popup and sound notifications for buy and sell signals, configurable via a streamlined settings interface.
Users can fully customize the indicator by adjusting Fast EMA, Slow EMA, and Signal Line lengths, toggling visibility of visual elements (lines, histogram, signals, labels), and modifying colors and line thickness. The settings are organized into intuitive categories for ease of use. This indicator supports a wide range of timeframes from minutes to monthly and is suitable for various markets including Forex, indices, commodities, stocks, and cryptocurrencies.
カスタマーレビュー
5 | 100 % | |
4 | 0 % | |
3 | 0 % | |
2 | 0 % | |
1 | 0 % |


![「[Stellar Strategies] Inside Bar with Signals」ロゴ](https://cdn.ctrader.com/image/webp/1d9e8bfa-3b2c-4440-bb37-5856902008a7_30683)
