
HTFBB
インジケーター
1 購入済
バージョン 1.0、Jul 2025
Windows、Mac
5.0
レビュー: 1
説明
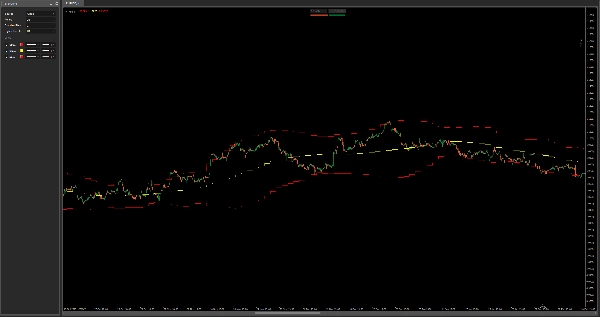
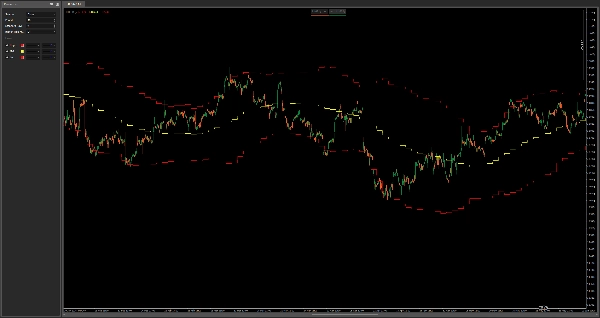
HTFボリンジャーバンド – マルチタイムフレームボラティリティマップ
このインジケーターはより高い時間枠のボリンジャーバンドを現在のチャートに表示し、時間枠を切り替えることなく、ボラティリティ、平均回帰、動的なサポート/レジスタンスの強力なコンテキストを提供します。
特徴:
- 任意の選択可能な高い時間枠からの上部、中間、下部のボリンジャーバンドを表示
- HTFの統合ゾーン、ブレイクアウト圧力、およびトレンドのプルバックを見つけるのに最適
- 高い時間枠の認識を持つスキャルピングや日中のエントリーに理想的
- すべての資産と時間枠で機能
現在の戦略と組み合わせて、ボラティリティトラップでの取引を避け、マクロな価格構造と整合させ続けましょう。
概要
インジケーターのプロフィール
カスタマーレビュー
5.0
レビュー: 1
5 | 100 % | |
4 | 0 % | |
3 | 0 % | |
2 | 0 % | |
1 | 0 % |
カスタマーレビュー
July 29, 2025
confusing signals get easier to ignore, but a clean signal can still fail.
ディスカッション
よくあるご質問
cTrader Storeで入手可能な取引ボット、インジケーター、プラグインなどの商品は、第三者の開発者が提供するものであり、情報と技術の取得のみを目的としてご利用いただけます。cTrader Storeはブローカーではなく、投資助言や個人的な推奨を行うことも、将来のパフォーマンスを保証することもありません。


価格
登録日 03/01/2025
638.03K
取引数量
21.34K
獲得pips
15
販売