
SupertrendChannels
インジケーター
バージョン 1.0、Jul 2025
Windows、Mac
4.5
レビュー: 2
説明
Supertrend Channels は、トレーダーが視覚的に識別するのを助けるために設計されたカスタムオーバーレイインジケーターです 動的なサポートおよびレジスタンスゾーン、エントリーシグナル、および トレーリングストップロスレベル をATRベースのロジックを使用して。
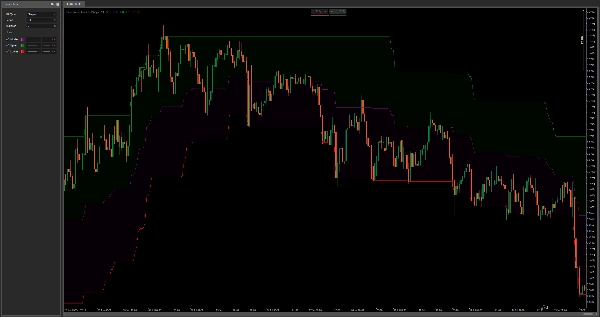
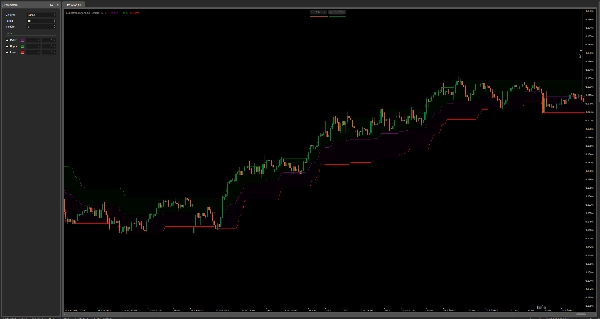
インジケーターは3本のラインをプロットします:
- 上部バンド(緑)– ロングトレードの動的なレジスタンスまたはトレーリングストップロスとして機能します。
- 下部バンド(赤)– ショートトレードの動的なサポートまたはトレーリングストップロスとして機能します。
- 中央線(紫)– 平均回帰レベルまたは潜在的なエントリーポイントとして機能します。
バンドは、ユーザー定義の係数(Multiplier)を掛けた平均真の範囲(ATR)を使用して計算され、現在のローソク足の高値/安値に加算/減算されます。応答性を調整するためにATRに平滑化方法(選択可能なMAタイプ)が適用されます。
使い方:
- エントリー:統合期間中またはクロスシグナル後に 中央線付近でのエントリーを探します。
- トレーリングストップロス:トレンドが続くにつれて利益を確保するために、動的な出口ゾーンとして 上部/下部バンド を使用します。
- サポート&レジスタンス:これらのバンドは、最近のボラティリティを反映し、潜在的な転換点を見つけるのに役立つ適応ゾーンのように機能します。
標準のボリンジャーバンドとは異なり、このアプローチは移動平均ではなく、価格の極値とボラティリティを基準にバンドを設定するため、トレンド環境でより応答性が高く、裁量取引やアルゴリズム取引により適応します。
概要
インジケーターのプロフィール
カスタマーレビュー
4.5
レビュー: 2
5 | 50 % | |
4 | 50 % | |
3 | 0 % | |
2 | 0 % | |
1 | 0 % |
カスタマーレビュー
July 26, 2025
the idea is fine, just do not expect it to print perfect entries. Win rate means less without average R.
July 25, 2025
The reason it feels usable is the plan does not get lost as quickly. The market context still matters.
ディスカッション
よくあるご質問
cTrader Storeで入手可能な取引ボット、インジケーター、プラグインなどの商品は、第三者の開発者が提供するものであり、情報と技術の取得のみを目的としてご利用いただけます。cTrader Storeはブローカーではなく、投資助言や個人的な推奨を行うことも、将来のパフォーマンスを保証することもありません。


価格
登録日 03/01/2025
638.03K
取引数量
21.34K
獲得pips
15
販売