
説明
cTrader用VixFixインジケーター
ニュースが出る前に市場のパニックを捉える。
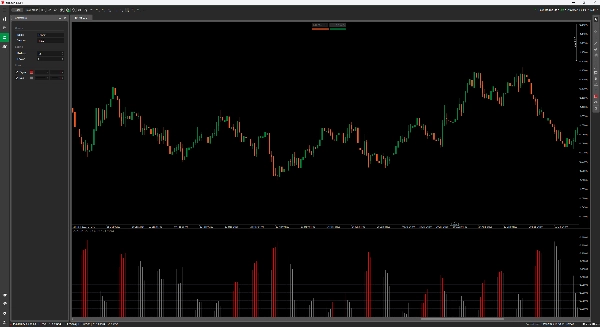
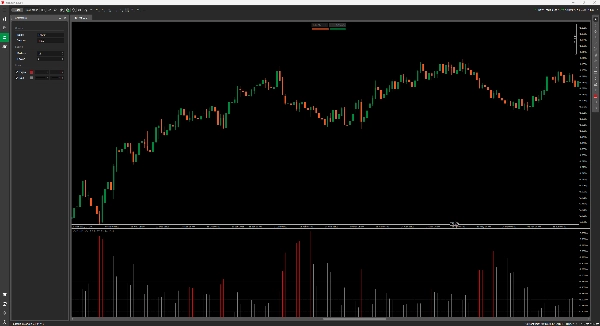
このVixFixインジケーターは、ラリー・ウィリアムズのクラシックな「VIX Fix」コンセプトをスマートに適応したもので、トレーダーが短期的な恐怖とボラティリティの急増を検出するのに役立ちます。特に潜在的な市場の底を特定するのに有用です。
仕組み
- 最近の安値と設定可能な期間内の最高値(デフォルト:12)を比較して擬似的なボラティリティの急増を計算します。
- 移動平均と標準偏差のエンベロープを適用し、シグナルスパイクを通常のノイズから分離します。
- ボラティリティが閾値を超えたときに赤いヒストグラムバーをプロットします。これが注意を払い始める合図です。
特徴
- クリーンなヒストグラム表示(オーバーレイなし)
- 二色のプロット:
-
- 赤 = シグナル(閾値を超えたボラティリティスパイク)
- 灰色 = 通常の活動
- 調整可能な期間と感度ファクター
- ゼロインジケーター遅延—生の価格アクションのみを使用し、再描画なし
使用例
- ダウントレンドにおける潜在的な反転を見つける
- 平均回帰取引のタイミング
- RSIや他の遅延ツールに頼らずに売られ過ぎ状態を確認する
概要
インジケーターのプロフィール
カスタマーレビュー
4.0
レビュー: 1
5 | 0 % | |
4 | 100 % | |
3 | 0 % | |
2 | 0 % | |
1 | 0 % |
ディスカッション
よくあるご質問
cTrader Storeで入手可能な取引ボット、インジケーター、プラグインなどの商品は、第三者の開発者が提供するものであり、情報と技術の取得のみを目的としてご利用いただけます。cTrader Storeはブローカーではなく、投資助言や個人的な推奨を行うことも、将来のパフォーマンスを保証することもありません。


価格
登録日 03/01/2025
638.03K
取引数量
21.34K
獲得pips
15
販売