
説明
- チャートをトレンドの明確さの視覚的シンフォニーに変えましょう。
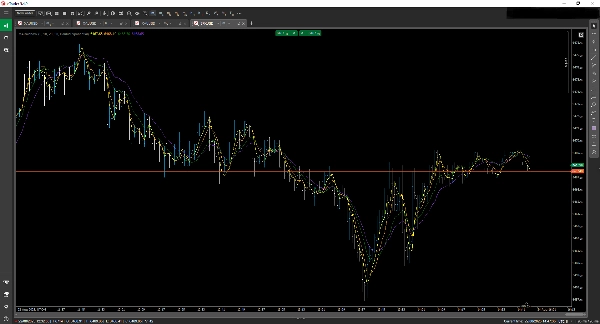
MARainbowインジケーターは、精度、柔軟性、美的明瞭さを求めるトレーダーのために設計された洗練された多層移動平均ツールです。デイトレードのスキャルピングから長期トレンドの分析まで、MARainbowは4つのカスタマイズ可能な移動平均を提供し、それぞれが即座に認識できるように色分けされています。
🔧 主な特徴
• 4つの異なる移動平均
最大4つの移動平均を同時に表示し、それぞれに独自の色と期間設定を持たせて視覚的に素早く区別できます。
• 複数のMAタイプ
以下から選択可能:
• 単純移動平均(SMA)
• 指数移動平均(EMA)
• 二重指数移動平均(DEMA)
• その他。
戦略に合わせて組み合わせてください。
• カスタマイズ可能な入力
• 各MAの期間を個別に選択可能
• チャートの読みやすさ向上のために独自の色を割り当て
• 各ラインの表示・非表示を独立して切り替え可能
• 一目でわかるトレンドの明確さ
レインボー効果により、トレンドの方向、強さ、潜在的な反転を即座に識別できます。もう迷うことはありません。
• cTraderに最適化
cTraderプラットフォームとシームレスに統合し、スムーズなパフォーマンスと直感的な設定を提供します。
概要
インジケーターのプロフィール
カスタマーレビュー
4.0
レビュー: 2
5 | 0 % | |
4 | 100 % | |
3 | 0 % | |
2 | 0 % | |
1 | 0 % |
カスタマーレビュー
September 4, 2025
not perfect, but the workflow felt cleaner. H1 makes the signal less noisy.
August 24, 2025
ディスカッション
よくあるご質問
Forex
Indices
Commodities
Crypto
Stocks
cTrader Storeで入手可能な取引ボット、インジケーター、プラグインなどの商品は、第三者の開発者が提供するものであり、情報と技術の取得のみを目的としてご利用いただけます。cTrader Storeはブローカーではなく、投資助言や個人的な推奨を行うことも、将来のパフォーマンスを保証することもありません。


価格
25
販売
2.12K
無料インストール