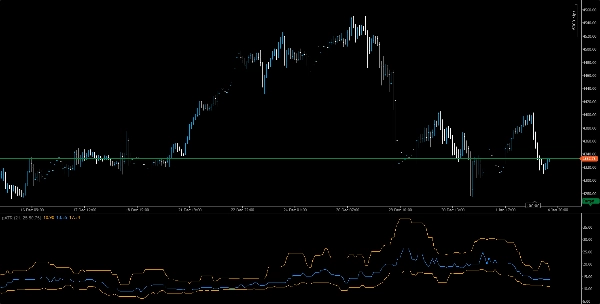
ブローカー&プロップファーム
事業者向け
00
Days
:
00
Hours
:
00
Minutes
:
00
Seconds
pATR
「pATR」ロゴ
登録日 08/08/2025
販売
6
無料インストール
981


📈 pATR – Percentile Average True Range

Precision Volatility. Smarter Risk. Institutional Edge.

The pATR indicator redefines traditional ATR by applying a percentile-based filter to recent true range values, giving traders a statistically grounded view of volatility. Instead of relying on simple averages, pATR calculates the nth percentile of recent price movement intensity — helping you identify breakout zones, fade setups, and risk thresholds with surgical accuracy.

Whether you're navigating prop firm challenges or refining your scalping strategy, pATR delivers a dynamic volatility benchmark that adapts to market conditions and keeps your risk calibrated.


🔍 Key Features

Percentile-Based ATR: Filters out noise and tail events for cleaner volatility signals

Circular Buffer Logic: Optimized for speed and memory efficiency — no lag, no clutter

Challenge Mode Ready: Ideal for prop firm traders managing drawdown and trade limits

Clean Visuals: Orange volatility line with intuitive scaling and overlay options

Multi-Timeframe Compatible: Use across M1 to H1 for breakout, fade, or trend setups


🧠 Use Cases

Breakout Confirmation: Use pATR spikes to validate momentum entries

Risk Calibration: Align stop-loss and position sizing with percentile volatility

Strategy Backtesting: Validate setups with consistent volatility thresholds


🎯 Who It's For

Prop firm traders seeking rule-based risk control

Scalpers and intraday strategists needing adaptive volatility filters

Quantitative traders integrating percentile logic into custom systems

Educators and mentors teaching volatility-aware execution

0.0
レビュー: 0
カスタマーレビュー
この商品にはまだレビューがありません。お使いになったことがある方は、ぜひレビューをお願いします。
この作成者の他の商品
FVG
The Indicator is a powerful tool for price-action traders seeking to identify and exploit short-term imbalances.
インジケーター
Indices
Prop
Stocks
+3
Fractals
Fractals is a precision-engineered trading indicator for cTrader that reveals the hidden architecture of price action.
インジケーター
Grid
NAS100
XAUUSD
+6
AutoFibRetracement
A powerful overlay tool designed to automatically plot Fibonacci retracement levels based on a custom window.
インジケーター
Indices
Prop
Stocks
+3
Smooth Heiken Ashi
The Smooth Heiken Ashi indicator is a refined charting tool designed to filter out market noise and highlight true price
インジケーター
NAS100
Indices
XAUUSD
+4
PrevDayProjection
Automatically calculates the previous day’s high and low, determines the range, and then projects Fibonacci levels.
cBot
NAS100
Indices
Breakout
+4
VolatilityScalper
A trading robot designed for traders who want precision for high-volatility markets (XAUUSD, US500, US100, WTI, others.)
インジケーター
NAS100
Indices
XAUUSD
+7
T3 Moving Average
A next‑generation moving average designed to deliver exceptional smoothness with minimal lag.
インジケーター
NAS100
Indices
XAUUSD
+7
InstitutionalSignalOscillator
A precision-engineered indicator designed for traders who demand signal integrity across volatile markets.
インジケーター
Breakout
AI
Scalping
KaufmanEfficiencyRatio
A precision tool for measuring how efficiently price moves from point A to B.
インジケーター
NAS100
Indices
XAUUSD
+6
OR Session Zones
A high‑precision Opening Range indicator that detects session opens (NY, London, EU, Tokyo, Shanghai)
DEnvelopSystem
DEnvelop is a high-performance trading indicator engineered for scalpers and intraday strategists who demand precision.
インジケーター
Indices
Prop
Commodities
+3
OBScope
A cutting-edge indicator designed to detect and visualize high-probability zones based on swing highs, swing lows.
インジケーター
Indices
Prop
Breakout
+3
RVI
A precision-crafted indicator that compares current volume to its historical average for the same time of day.
インジケーター
Indices
Breakout
XAUUSD
+3
AnchoredVWAP
A precision overlay tool that combines session-aware VWAP logic and standard deviations.
インジケーター
Indices
Prop
Breakout
+8
MarketRegimeAI
A cutting‑edge trading indicator that fuses AI and mathematics with adaptive logic to classify market regimes.
インジケーター
NAS100
Indices
XAUUSD
+6
JacksonZones
Maps intraday and multiday structure using Fibonacci-projected session ranges.
インジケーター
Indices
Commodities
Stocks
+2
MARainbow
MARainbow gives you the edge with four customizable moving averages—each color-coded for instant recognition.
これも好きかも
Advanced Regression Channel
Regression channels with Fibonacci levels across multiple regression types, timeframes, and custom date ranges.
DailyPivotPoints
Daily Pivot Points plots key support and resistance levels to guide precise trading decisions.
インジケーター
Indices
FVG
Commodities
+4
FAIR VALUE GAP INDICATOR
Pinpoint FVGs, track fills and see mitigation stats — trade imbalances with clarity and confidence.
インジケーター
RSI
XAUUSD
ATR
+3
RSI NextGen
The RSI NextGen is an advanced and modernized version of the classic Relative Strength Index (RSI)
インジケーター
NAS100
NZDUSD
Martingale
+26
OHLC PRO by LudwigICT
OHLC PRO – Advanced Session & Market Structure Tool
インジケーター
Indices
Stocks
Forex
+1
Bullet Chart Trend
Unique Pyramid Design , Clear Price Action Trend
Volume Profile Price
Volume Profile Price Period and Live VAH,VAL,POC,
インジケーター
RSI
Breakout
Supertrend
TrendMaster Pro MultiMA
Connects each moving average value from candle to candle, forming a fan-like structure of trendlines.
インジケーター
NAS100
Indices
XAUUSD
+4
PrevDayProjection
Automatically calculates the previous day’s high and low, determines the range, and then projects Fibonacci levels.
インジケーター
NAS100
NZDUSD
XAUUSD
+13
MACD Histogram PRO
Enhance MACD Histogram! Visualize bull and bear price changes with vibrant colors for clearer, more insightful trading.
インジケーター
Breakout
XAUUSD
Forex
+2
McDonalds Pattern-Bzier Curve
Designed to identify and visualize price reversal patterns using Bézier curves.
Alpha Sentiment Pro
Alpha Sentiment Pro - See the Market's Pulse Before It Moves
インジケーター
NAS100
Indices
Prop
+3
session indicator
📈 Trading Sessions Indicator — London, New York & Tokyo Visualize Key Market Sessions + High/Low Levels with Precision
インジケーター
NAS100
NZDUSD
XAUUSD
+11
TSI True Strength Index
Enhance trading with TSI! Use the True Strength Index for clear insights into market momentum and trend strength.
MM-HTF Bars
Shows bars from different Time Frame on zoom out and hides the current bars. Perfect tool for Multi TF "Market Reply"
インジケーター
Indices
Breakout
XAUUSD
+6
TMAX RBA 2026 ULTRA
🚀 TMAX RBA Indicator - The Ultimate Multi-Timeframe Momentum System 🚀
インジケーター
NAS100
Indices
XAUUSD
+7
T3 Moving Average
A next‑generation moving average designed to deliver exceptional smoothness with minimal lag.