
RT Stochastic RSI PRO
مؤشر
1 عمليات الشراء
الإصدار 1.0، Sep 2024
Windows, Mac
الوصف
تقديم Stochastic RSI PRO لمنصة cTrader، نسخة متقدمة من مؤشر Stochastic RSI المصمم لتعزيز دقة تداولك.
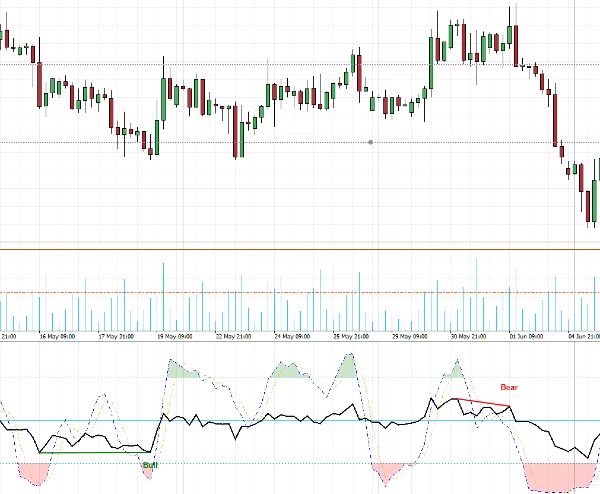
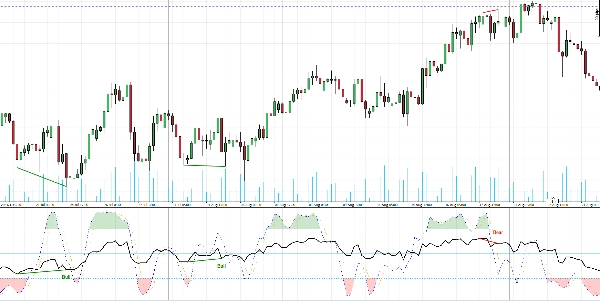
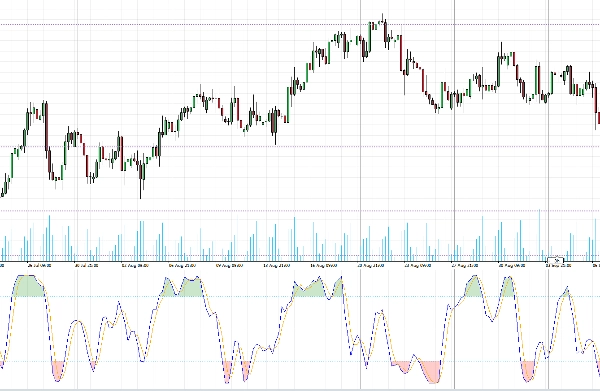
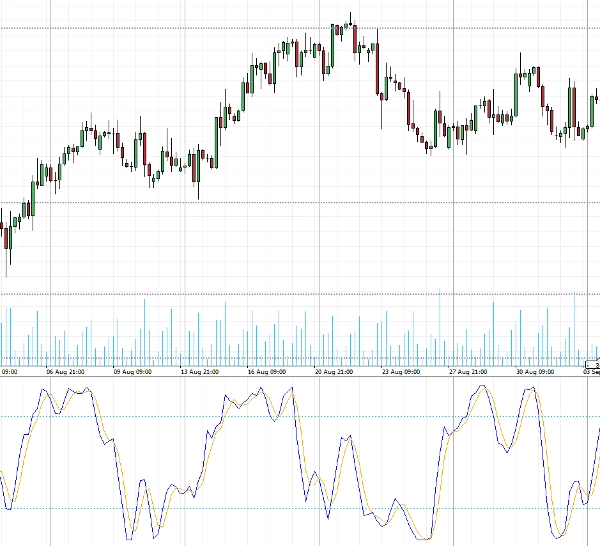
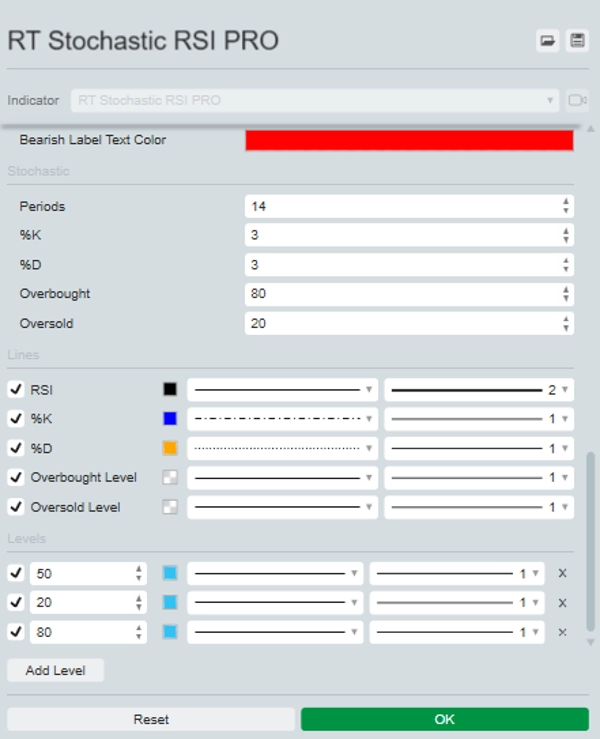
تقوم هذه الأداة القوية بوضع مؤشر RSI مباشرة على مؤشر Stochastic RSI، مما يوفر رؤية شاملة لزخم السوق. يبرز المناطق التي تشهد تشبع شراء وتشبع بيع بألوان مميزة لسهولة التعرف عليها.
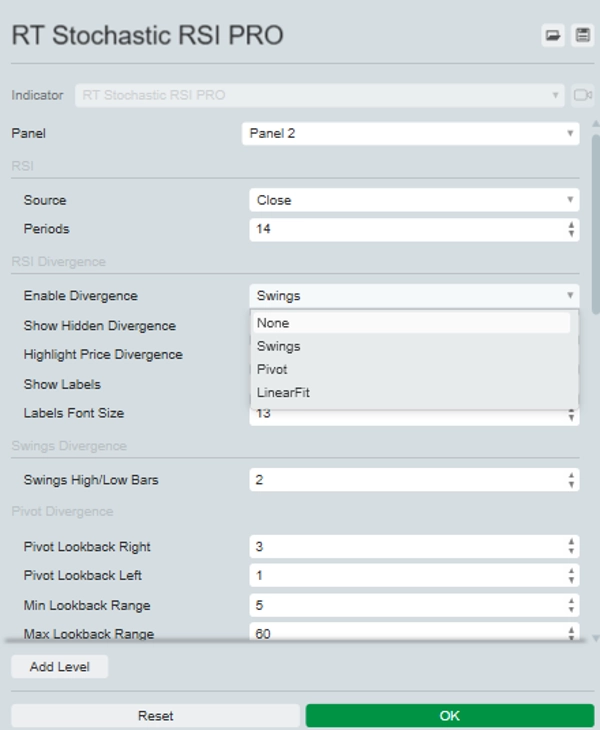
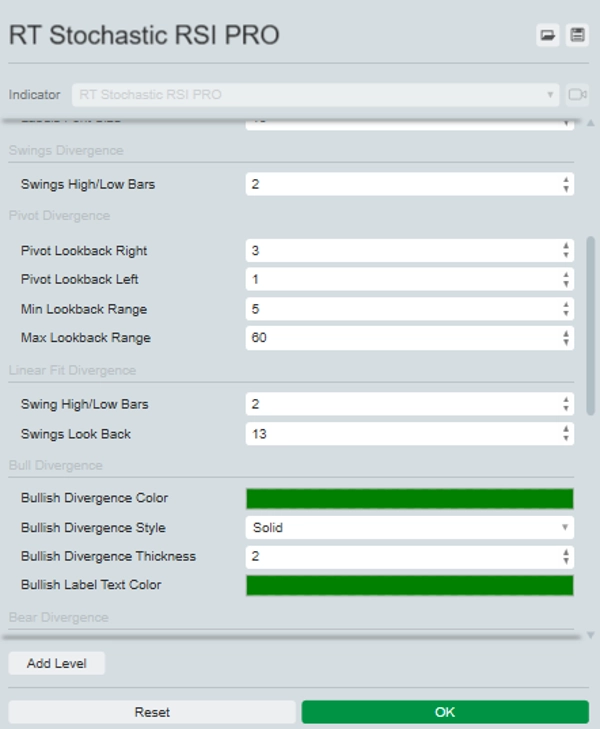
الميزة البارزة في Stochastic RSI PRO هي قدرته على تحديد وتسليط الضوء اختياريًا على كل من التباينات العادية والمخفية على الرسم البياني. يمكنك الاختيار من بين ثلاث طرق لتحديد التباينات: Swing، Pivot، أو Linear Fit، كل منها مع إعدادات قابلة للتخصيص لتتناسب مع استراتيجية تداولك.
ارتقِ بتحليلك واتخاذ قراراتك مع Stochastic RSI PRO، أداة لا غنى عنها للمتداولين المميزين.
الملخص
ملف تعريف المؤشر
تقييمات العملاء
0.0
التقييمات: 0
تقييمات العملاء
لا توجد تقييمات لهذا المنتج حتى الآن. هل جرَّبته بالفعل؟ كن أول من يخبر الآخرين!
مناقشة
الأسئلة الشائعة
BTCUSD
Forex
Signal
Scalping
Indices
EURUSD
Commodities
GBPUSD
RSI
Crypto
Stocks
XAUUSD
يتم توفير المنتجات المتاحة من خلال cTrader Store، بما في ذلك روبوتات التداول والمؤشرات والإضافات، من قبل مطوري الطرف الثالث وإتاحتها لأغراض الوصول المعلوماتي والفني فقط. cTrader Store ليس وسيطًا ولا يقدم نصائح استثمارية أو توصيات شخصية أو أي ضمان للأداء المستقبلي.


السعر
منذ 25/09/2024
20
المبيعات