
Opis
MACD Custom MTF (Multiple Time Frame) v1.1 jest zaawansowanym narzędziem łączącym sprawdzoną moc klasycznego MACD z kluczową przewagą analizy wielookresowej oraz nowoczesną, intuicyjną wizualizacją. Zaprojektowany dla wymagających traderów, którzy oczekują precyzji, szybkiej interpretacji oraz możliwości dostosowania narzędzi do swojej unikalnej strategii.
Co nowego w wersji 1.1:
- 100% Płynna Wizualizacja: Naprawiono przerwane/niespójne linie MACD – linie są teraz idealnie ciągłe podczas zmian trendu.
- Lepsza Widoczność: Zwiększono rozmiar kropek sygnałów Kupna/Sprzedaży, pogrubiono linię sygnału i histogram dla krystalicznie czystego widoku. Przyciemniono linię zerową, aby zmniejszyć zmęczenie oczu.
- Inteligentne i Uproszczone Alerty: Uproszczono okno ustawień. Wystarczy przełączyć "Alert Kupna" lub "Alert Sprzedaży", a wskaźnik automatycznie obsłuży wyskakujące okienka i poprawne powiadomienia dźwiękowe.
- Zorganizowane Ustawienia: Wszystkie parametry zostały teraz pięknie pogrupowane w intuicyjne kategorie dla znacznie lepszego doświadczenia użytkownika.
- Pełna Lokalizacja na Język Angielski: Wszystkie komunikaty dziennika, wyskakujące okienka i błędy zostały w pełni przetłumaczone na angielski.
Analiza Wielookresowa (MTF) na Jednym Wykresie:
Koniec z przełączaniem wykresów! Wyświetlaj dane MACD z wyższego interwału czasowego (np. H1, H4, D1) bezpośrednio na swoim aktualnym wykresie roboczym (np. M5, M15). Zyskaj bezcenny szerszy kontekst rynku, zidentyfikuj dominujące trendy bazowe i skutecznie odfiltruj mylący szum z niższych interwałów. W pełni konfigurowalne – wybierz z obszernej listy interwałów, od minutowych po miesięczne.
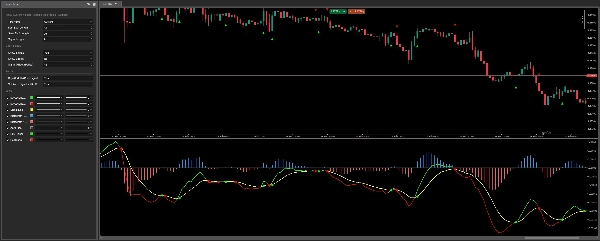
Dynamiczne Kolorowanie MACD i Linii Sygnału:
Natychmiastowe potwierdzenie trendu: linia MACD dynamicznie zmienia kolor po przecięciu linii sygnału, wyraźnie ilustrując momentum bycze lub niedźwiedzie. Koniec z domysłami – kolor linii natychmiast informuje, czy MACD jest powyżej (bycze) czy poniżej (niedźwiedzie) swojej linii sygnału.
Krystalicznie Czysty Histogram:
Łatwo wizualizuj dywergencję (siłę) między MACD a jego linią sygnału. Wskaźnik intuicyjnie koloruje pogrubione słupki w zależności od tego, czy są pozytywne (niebieskie), czy negatywne (czerwone), zapewniając głęboki wgląd w zmiany momentum na pierwszy rzut oka.
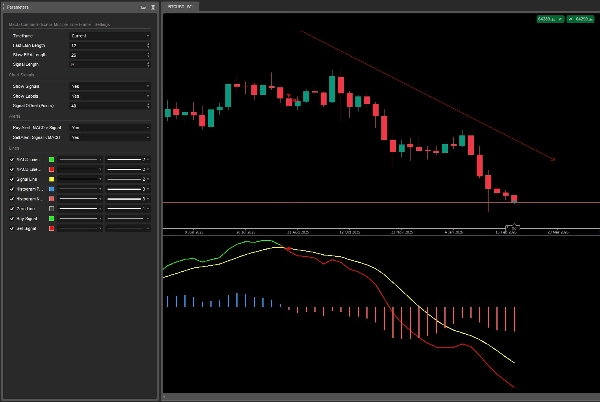
Niezawodne Wizualne Sygnały Przecięcia:
Nigdy więcej nie przegap krytycznego przecięcia! Wskaźnik automatycznie podświetla przecięcia linii MACD/Sygnału. Rysuje wyraźne, bardzo widoczne kropki bezpośrednio na wykresie cenowym (z regulowanym przesunięciem) i oferuje opcjonalne etykiety tekstowe "Kup"/"Sprzedaj" dla maksymalnej przejrzystości.
Zintegrowane Inteligentne Alerty:
Funkcje wbudowanych, bezproblemowych powiadomień Popup i dźwiękowych dla sygnałów Kupna i Sprzedaży. Bądź na bieżąco z każdą okazją, nie przyklejając się do ekranu! Wystarczy włączyć alerty w ustawieniach, a wskaźnik zajmie się resztą.
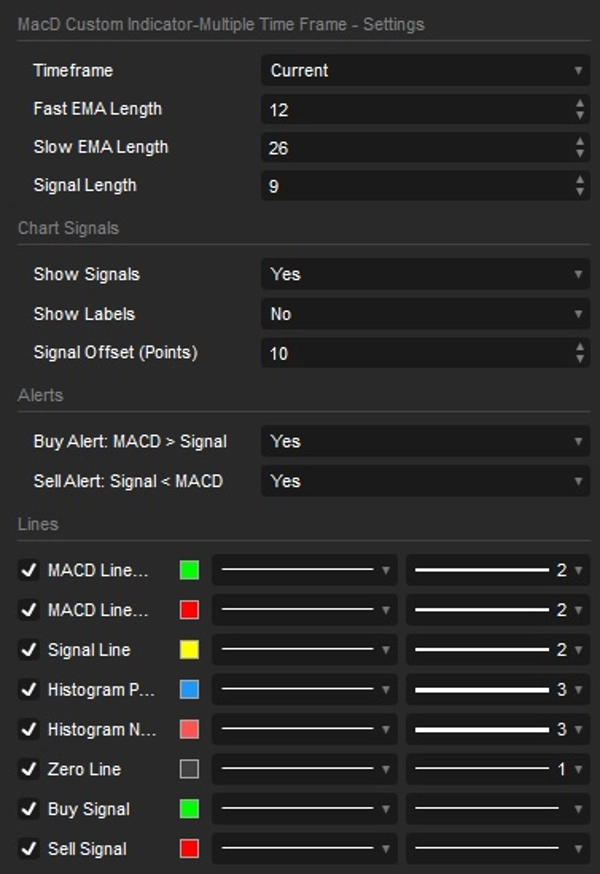
Pełna Personalizacja na Wyciągnięcie Ręki:
- Dostosuj długości szybkiej EMA, wolnej EMA oraz linii sygnału do swoich precyzyjnych wymagań.
- Wszystkie ustawienia są starannie zorganizowane w logiczne grupy (Ustawienia MACD, Sygnały na wykresie, Alerty) dla szybkich korekt.
- Przełączaj widoczność poszczególnych elementów wizualnych: linie MACD i sygnału, histogram, sygnały przecięcia i etykiety.
- Regulowane przesunięcie sygnału, aby idealnie dopasować estetykę i preferencje wykresu.
Podsumowanie
Key features include dynamic coloring of the MACD and signal lines to indicate bullish or bearish momentum, a crystal-clear histogram that visualizes the divergence between MACD and its signal line with color-coded bars, and unmistakable visual crossover signals marked by distinct dots or arrows on the price chart. The indicator supports integrated alerts with popup and sound notifications for buy and sell signals, configurable via a streamlined settings interface.
Users can fully customize the indicator by adjusting Fast EMA, Slow EMA, and Signal Line lengths, toggling visibility of visual elements (lines, histogram, signals, labels), and modifying colors and line thickness. The settings are organized into intuitive categories for ease of use. This indicator supports a wide range of timeframes from minutes to monthly and is suitable for various markets including Forex, indices, commodities, stocks, and cryptocurrencies.
Opinie klientów
5 | 100 % | |
4 | 0 % | |
3 | 0 % | |
2 | 0 % | |
1 | 0 % |


