Описание
✅ Определяет перекупленность и перепроданность с нормализованным моментумом
✅ Использует сглаженную центральную цену на основе EMA для стабильного формирования сигналов
✅ Отображает двойные гистограммы (Oo и Ll) для визуализации давления моментума
✅ Цветные бары мгновенно показывают бычьи, медвежьи или неопределённые фазы
✅ Отмечает точные точки ПОКУПКИ и ПРОДАЖИ с помощью строгих стрелок пересечения
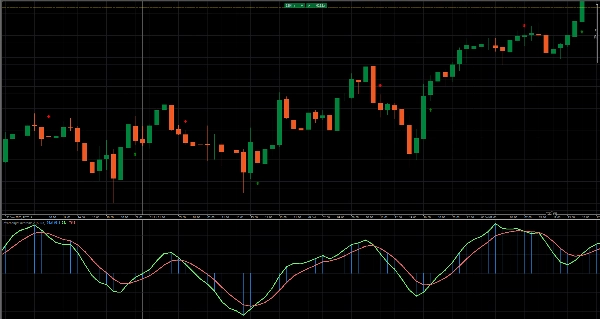
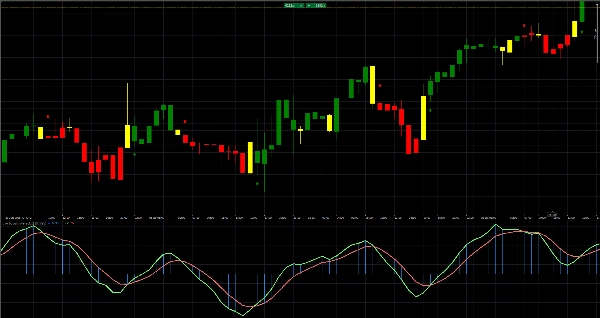
Повышайте точность тайминга с помощью индикатора перекупленности / перепроданности: он вычисляет сглаженную центральную цену (ys1) через EMA, нормализует моментум с помощью стандартного отклонения и строит двойные гистограммы (Oo и Ll) вместе с линиями EMA вверх/вниз. Цветные бары мгновенно выделяют бычьи (зелёные), медвежьи (красные) или неопределённые (жёлтые) изменения моментума, а строгие стрелки пересечения отмечают точные точки покупки и продажи. Добавьте этот оверлей на ваш график для кристально чистых сигналов перекупленности/перепроданности и уверенно выбирайте моменты входа и выхода!
Также доступен как CBOT overbought oversold cbot cBot - cTrader Store
Сводка
Отзывы покупателей
5 | 100 % | |
4 | 0 % | |
3 | 0 % | |
2 | 0 % | |
1 | 0 % |