
ORB v1.1
インジケーター
4 購入済
バージョン 1.0、Jun 2025
Windows、Mac
4.0
レビュー: 3
説明
このクリーンでカスタマイズ可能なオープニングレンジブレイクアウトツールで強力なマーケット構造を解き放ちましょう。
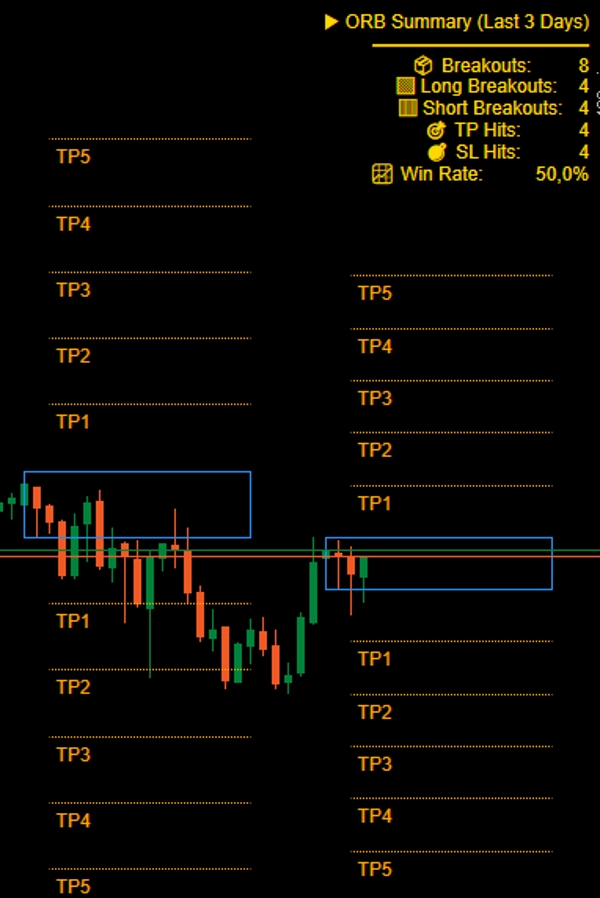
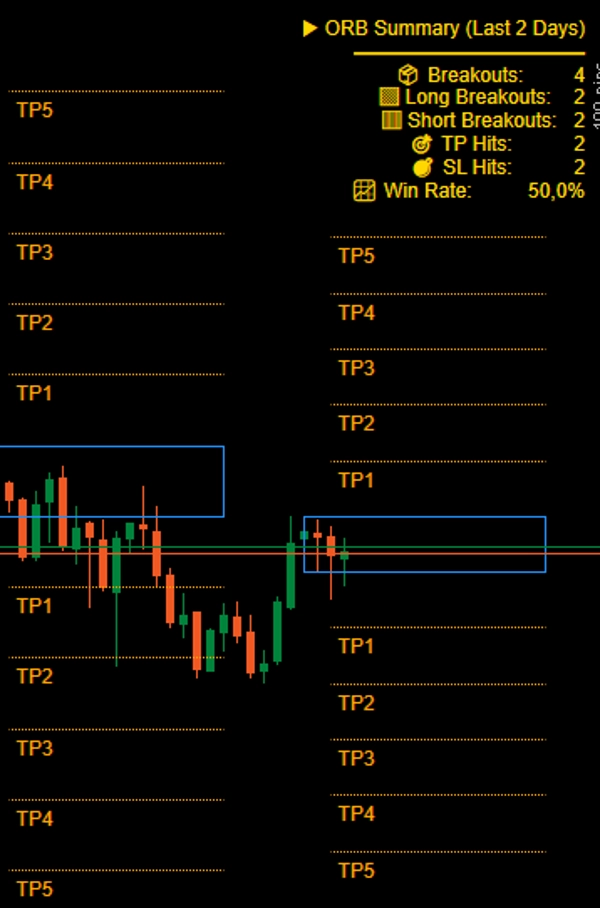
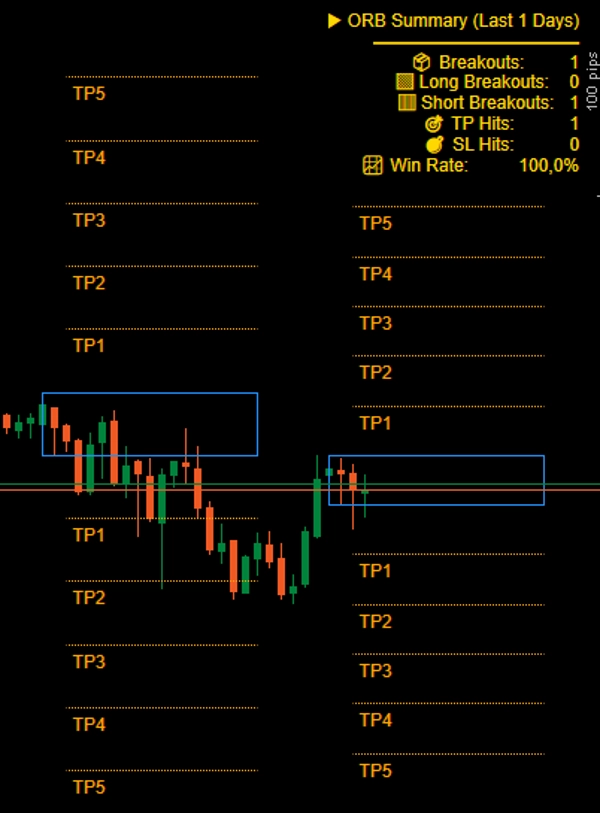
ライブ統計で高確率のブレイクアウトを追跡!動的なTP/SL追跡と、勝率やブレイクアウト結果を監視するためのクリーンな統計パネル。
オプションの利食いレベル付きでデュアルセッションのブレイクアウトボックスを描画。ORBやボラティリティベースのセットアップを使うトレーダーに最適です。
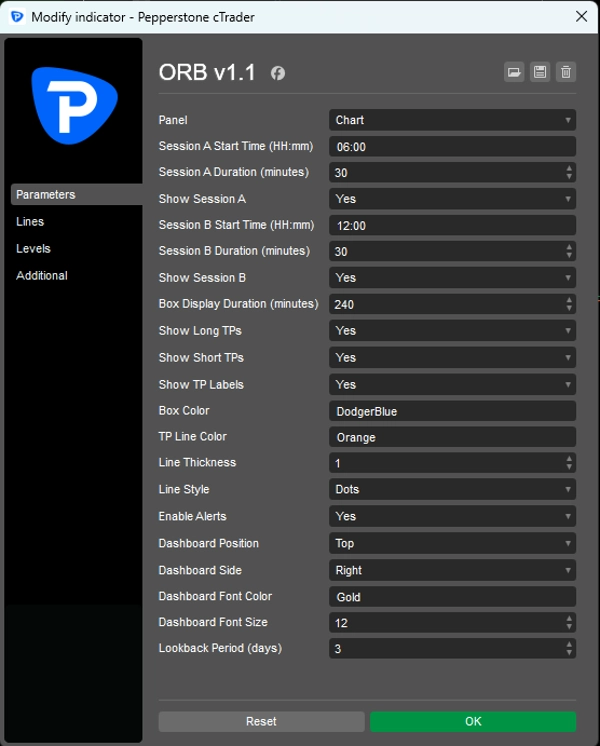
🕐 カスタムセッション時間を定義
📦 クリーンなブレイクアウトボックスを表示
🎯 スタイリングオプション付きのTPレベル(1R〜5R)を表示
🎨 完全に設定可能な色、ラベル、ラインスタイル
🧭 シンプルで高速、無駄がなく必要なものだけ
手動戦略の実行や独自のロジックとの組み合わせに理想的です。
精度とパフォーマンスを一つのツールで求めるトレーダーに最適です。
概要
AIによる概要
ORB v1.1 is an indicator tool designed to identify and visualize Opening Range Breakouts (ORB) in trading markets. It features customizable session times and draws dual-session breakout boxes on charts, aiding traders in spotting high-probability breakout opportunities. The tool includes dynamic take-profit (TP) and stop-loss (SL) tracking with configurable TP levels ranging from 1R to 5R, allowing users to tailor exit strategies visually. A clean, fully customizable stats panel displays live breakout statistics, including win rates and breakout outcomes, supporting manual strategy execution or integration with other trading logic. Users can adjust colors, labels, and line styles for clarity and personal preference. The indicator is optimized for traders employing ORB or volatility-based setups, providing a simple, fast, and uncluttered interface to enhance precision and performance in breakout trading analysis.
インジケーターのプロフィール
カスタマーレビュー
4.0
レビュー: 3
5 | 0 % | |
4 | 100 % | |
3 | 0 % | |
2 | 0 % | |
1 | 0 % |
カスタマーレビュー
July 8, 2025
2 level touches keeps the first run grounded. The trade rules stay clearer.
July 2, 2025
A 1R exit plan makes review easier. It gives the trader a reason to pause.
ディスカッション
よくあるご質問
Breakout
cTrader Storeで入手可能な取引ボット、インジケーター、プラグインなどの商品は、第三者の開発者が提供するものであり、情報と技術の取得のみを目的としてご利用いただけます。cTrader Storeはブローカーではなく、投資助言や個人的な推奨を行うことも、将来のパフォーマンスを保証することもありません。
この作成者の他の商品


価格
登録日 24/04/2025
161.83M
取引数量
17.59K
獲得pips
11
販売
328
無料インストール