
DailyMA
Индикатор
1 покупки
Версия 1.0, Nov 2025
Windows, Mac
5.0
Отзывы: 1
Описание
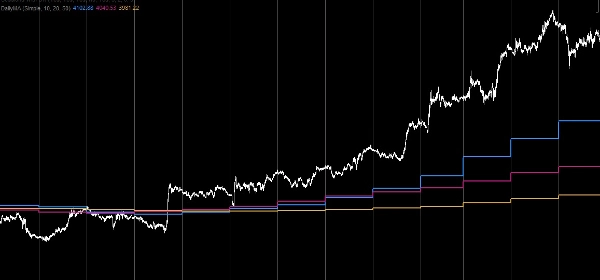
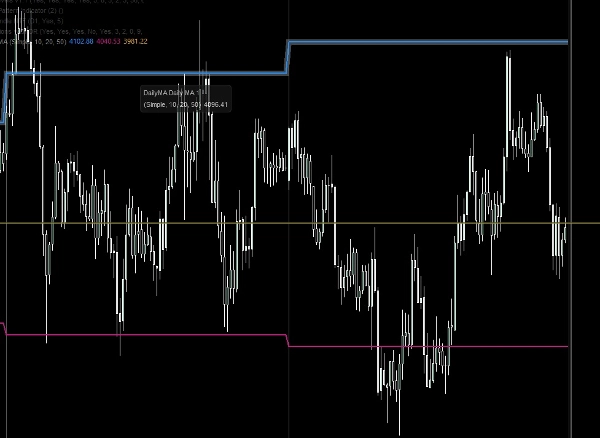
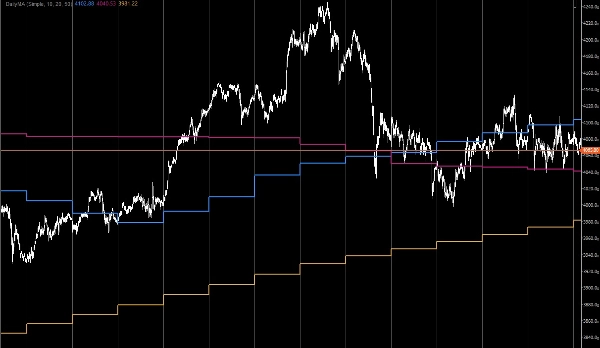
Индикатор Daily Moving Average Indicator предназначен для трейдеров, которые хотят наложить структуру более высокого таймфрейма на свои внутридневные графики. Он рассчитывает и отображает до трёх скользящих средних за день непосредственно на графиках с меньшим таймфреймом, давая вам чёткое представление о динамике дневного тренда при торговле на более низких интервалах.
Основные характеристики:
- Три скользящих средних за день, построенные одновременно для улучшенного анализа тренда
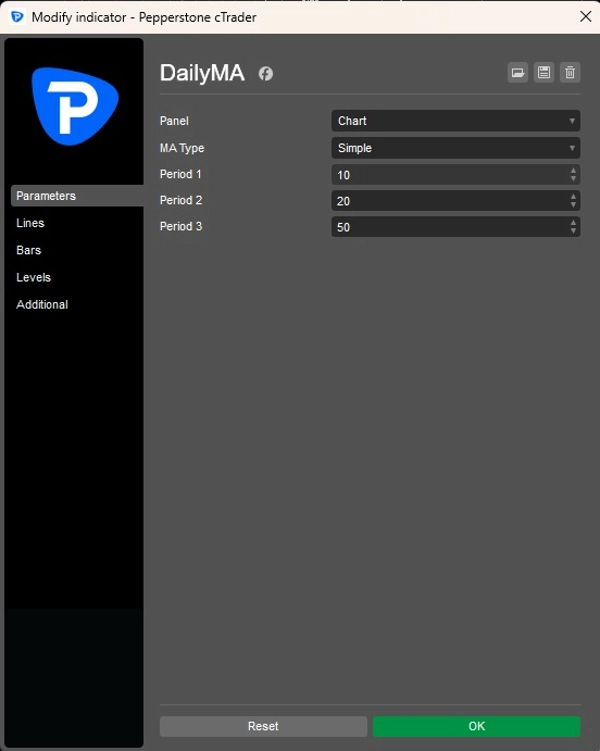
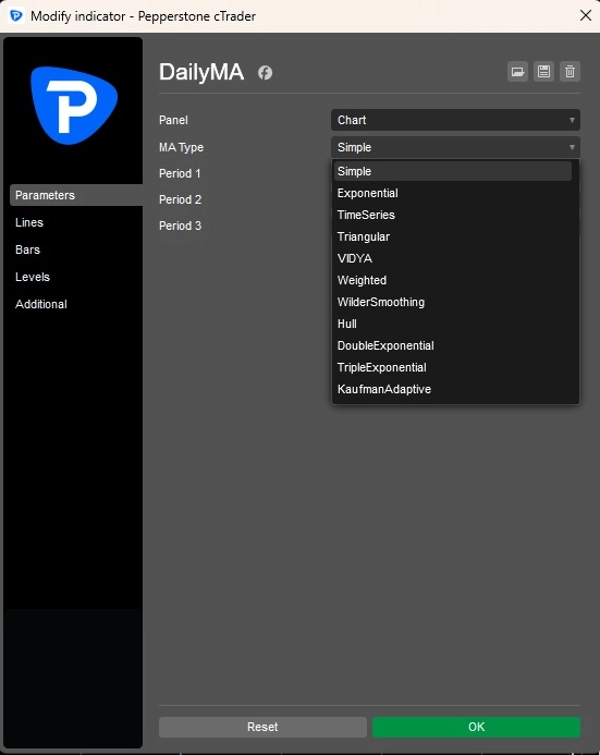
- Выбор типа скользящей средней (SMA, EMA, WMA и др.) для каждой линии
- Автоматический дневной расчёт независимо от таймфрейма графика
- Минималистичный дизайн — фиксированные цвета и стили для последовательности и ясности
Этот индикатор идеально подходит для трейдеров, которые опираются на дневные уровни для принятия внутридневных решений, предлагая простой, но мощный способ сохранять видимость контекста более высокого таймфрейма без загромождения или ненужной настройки.
Сводка
Профиль индикатора
Отзывы покупателей
5.0
Отзывы: 1
5 | 100 % | |
4 | 0 % | |
3 | 0 % | |
2 | 0 % | |
1 | 0 % |
Обсуждение
Частые вопросы
Signal
Indices
Commodities
GBPUSD
RSI
Bollinger
Fibonacci
Scalping
XAUUSD
NAS100
MACD
BTCUSD
Forex
Breakout
EURUSD
NZDUSD
Prop
ZigZag
Supertrend
Fair Value Gap
SMC
Crypto
Stocks
ATR
USDJPY
VWAP
Продукты, доступные в cTrader Store, включая торговых ботов, индикаторы и плагины, предоставляются сторонними разработчиками и доступны исключительно в информационных и технических целях. cTrader Store не является брокером и не предоставляет инвестиционные консультации, персональные рекомендации или какие-либо гарантии будущей доходности.
Больше от этого автора


Цена
С 24/04/2025
161.21M
Торгуемый объем
17.56K
Выигранные пипы
11
Продажи
328
Бесплатные установки