
説明
任意の時間枠で5つのプロフェッショナルなピボット手法を使用してサポートおよびレジスタンスレベルを計算します。
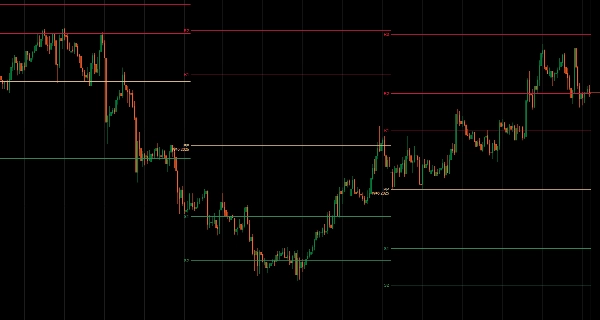
M5から月次データまでの各期間に対して時間制限付き表示でピボットレベル(スタンダード、フィボナッチ、ウッディ、カマリラ、デマーク)を自動生成します。
異なるS/R間隔ロジックを持つ5つの計算アルゴリズム、設定可能なサポート/レジスタンスレベル(各サイド0〜6)、複数の過去期間のヒストリカルピボット表示、自動ラベル付きライン(PP、R1-R6、S1-S6)、および色分けされた視覚化により、主要な価格レベルと日中の反転を狙うトレーダーに機関投資家レベルのピボット分析を提供します。
特徴
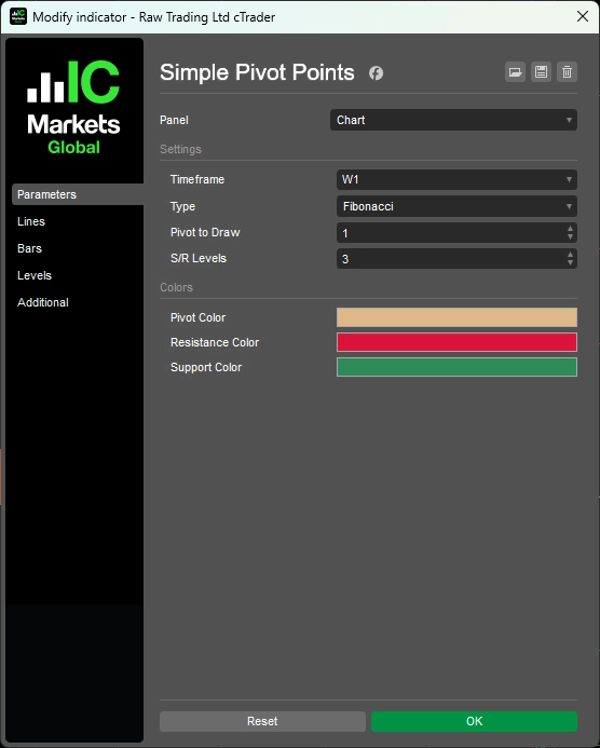
5つの計算方法
- スタンダード:クラシックなフロアトレーダーの公式—世界で最も注目されているピボット
- フィボナッチ:S/R間隔にフィボナッチ比率(38.2%、61.8%、100%、138.2%、161.8%)を使用
- ウッディ:終値に重みを置き、最近の価格変動により反応しやすい
- カマリラ:1.1/12の乗数を使ったタイトな日中レベル—スキャルピングに人気
- デマーク:終値と始値の関係に基づく条件付き公式—S/Rレベルは1つのみだが非常に信頼されている
完全カスタマイズ
- 任意の時間枠:M5、H1、H4、日次、週次、月次データから計算可能
- ヒストリカルピボット:複数の過去期間(例:過去3週間のピボット)まで表示可能
- 設定可能なレベル:各サイドに0〜6のサポート/レジスタンスレベルを表示
- 自動ラベル付きライン:PP、R1-R6、S1-S6が明確にマークされる
- 時間制限付きライン:各期間のピボットはその期間の間のみ表示される
- 色分け:ピボット(タン)、レジスタンス(赤)、サポート(緑)
__________________________________________________________________________________________
その他の無料インジケーター
構造やボリュームから回帰、ボラティリティ、カスタム時間枠まで幅広い市場分析ツールを探索してください。
ソースコードはGitHub リポジトリで利用可能です。
すべて無料で使用できますが、コーヒーサポートを送りたい場合は こちらからどうぞ。
サポート/レジスタンス
ボリューム
移動平均
- SSLチャネル
- アンカード移動平均
- 偏差スケール移動平均
- ギャンハイローアクティベーター
- 瞬時トレンドライン
- トレンドビジョン付きカウフマン適応MA
- 移動平均チャネル
- 移動平均スイート
- トレンドチャネル移動平均
ユーティリティ/カスタム
回帰ベース
ボラティリティ
オシレーター
__________________________________________________________________________________________
免責事項
取引にはリスクが伴います。このインジケーターはテクニカル分析専用です。常に適切なリスク管理を行い、責任を持って取引してください。
フィードバックと改善
ご提案、機能リクエスト、改善案がある場合は、ディスカッションタブにコメントを残してください。皆様のフィードバックがインジケーターの改善に役立ちます。
概要
カスタマーレビュー
5 | 100 % | |
4 | 0 % | |
3 | 0 % | |
2 | 0 % | |
1 | 0 % |


![「Smart Money Concepts (SMC) [Iridio Capital]」ロゴ](https://cdn.ctrader.com/image/webp/28b69fd1-ef54-4bed-9487-07e78e883be4_40934)


