
Описание
ОБЗОР
Анализ Распределения Объема (VSA) — это методология, разработанная Томом Уильямсом, бывшим трейдером синдиката, основанная на работах Ричарда Уайкоффа начала 1900-х годов. VSA интерпретирует взаимосвязь между объемом, диапазоном цены (spread) и расположением закрытия, чтобы выявить дисбаланс спроса и предложения.
Ключевые концепции VSA:
- Объем показывает уровень активности — кто участвует
- Диапазон (Spread) показывает волатильность и неопределенность — насколько далеко цена двигалась
- Расположение закрытия показывает, кто выиграл бар — покупатели или продавцы
- Контекст показывает, на каком этапе рыночного цикла мы находимся — фаза силы или слабости
Когда объем увеличивается при широком диапазоне, но при этом цена продвигается мало, это указывает на поглощение (одна сторона поглощает давление другой). Когда объем уменьшается при узком диапазоне в тренде, это указывает на отсутствие участия (возможная слабость).
Эта реализация:
Этот индикатор количественно оценивает концепции VSA с помощью статистических методов. Он отличается от традиционного VSA несколькими аспектами:
- Использует
(close - open) / rangeкак метрику эффективности (не используется в оригинальном VSA) - Паттерны поглощения определяют "выигрыш одной стороны", а не традиционное "поглощение давления"
- ENR (Effort No Result) количественно оценивается с помощью порога эффективности; оригинальный VSA более интерпретативен
- Использует усеченное среднее для усреднения объема (устойчивое к выбросам) и ранжирование по процентилям для диапазона
- Не включает: паттерны Stopping Volume, Upthrust, Test, Shakeout
Это количественный, алгоритмический подход к концепциям VSA. Традиционный VSA более интерпретативен и зависит от контекста. Используйте этот индикатор как один из аналитических инструментов, а не как самостоятельные сигналы.
ЧТО ДЕЛАЕТ ЭТОТ ИНДИКАТОР
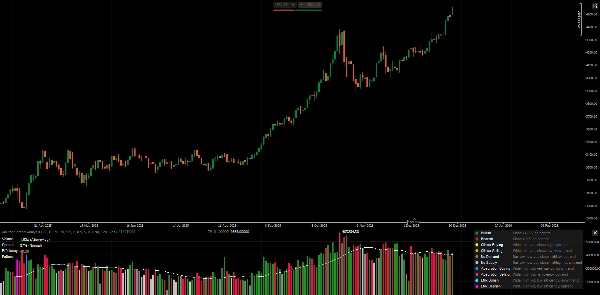
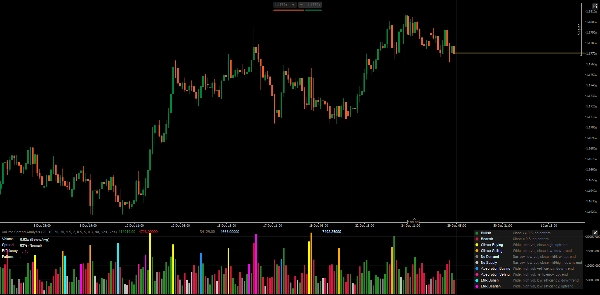
Анализирует объем, диапазон и расположение закрытия каждого бара для выявления потенциальных дисбалансов спроса/предложения. Отображает гистограмму объема, окрашенную по типу паттерна, с панелью метрик в реальном времени.
ОПРЕДЕЛЕНИЯ ПАТТЕРНОВ
1. Стандартные бары (Без паттерна)
- Бычий: Закрытие ≥ 0.5 в диапазоне, особых паттернов не обнаружено
- Медвежий: Закрытие < 0.5 в диапазоне, особых паттернов не обнаружено
2. Климаксные паттерны (Потенциальное истощение)
- Климакс покупок: Широкий диапазон + ультра-высокий объем + закрытие высоко + в восходящем тренде
-
- Интерпретация: Возможное истощение покупок, ожидайте разворот
- Климакс продаж: Широкий диапазон + ультра-высокий объем + закрытие низко + в нисходящем тренде
-
- Интерпретация: Возможное истощение продаж, ожидайте разворот
3. Слабые паттерны (Отсутствие убежденности)
- Нет спроса: Узкий диапазон + низкий объем + закрытие в середине/ниже + в восходящем тренде
-
- Интерпретация: Покупатели не поддерживают ралли, возможная слабость
- Нет предложения: Узкий диапазон + низкий объем + закрытие в середине/выше + в нисходящем тренде
-
- Интерпретация: Продавцы не давят вниз, возможная сила
4. Паттерны поглощения (Победа одной стороны)
- Поглощение покупок: Широкий диапазон + высокий объем + положительная эффективность + в нисходящем тренде
-
- Интерпретация: Покупатели поглощают давление продаж, возможный разворот вверх
- Поглощение продаж: Широкий диапазон + высокий объем + отрицательная эффективность + в восходящем тренде
-
- Интерпретация: Продавцы поглощают давление покупок, возможный разворот вниз
5. Паттерны ENR (Усилие без явного результата)
- ENR бычий: Широкий диапазон + высокий объем + низкая эффективность + в нисходящем тренде
-
- Интерпретация: Высокое усилие, но нет явного победителя, возможная поддержка/неопределенность
- ENR медвежий: Широкий диапазон + высокий объем + низкая эффективность + в восходящем тренде
-
- Интерпретация: Высокое усилие, но нет явного победителя, возможное сопротивление/неопределенность
ПАНЕЛЬ МЕТРИК ОБЪЯСНЕНА
Объем
- Показывает объем текущего бара как отношение к усеченному среднему (например, "1.85x")
- Классификация: Низкий / Ниже среднего / Выше среднего / Высокий / Ультра высокий
- Высокий объем = участие рынка, но важен контекст
Диапазон (Spread)
- Показывает процентильный ранг (0-100%) относительно недавних баров
- Классификация: Узкий / Нормальный / Широкий
- Широкий диапазон = волатильность/неопределенность, не обязательно направление
Эффективность
- Формула:
(close - open) / (high - low) - Диапазон: от -1.0 до +1.0
- Положительное = бычье тело доминирует в диапазоне
- Отрицательное = медвежье тело доминирует в диапазоне
- Близко к нулю = маленькое тело, длинная тень, неопределенность
Паттерн
- Текущий обнаруженный паттерн (или "-" если отсутствует)
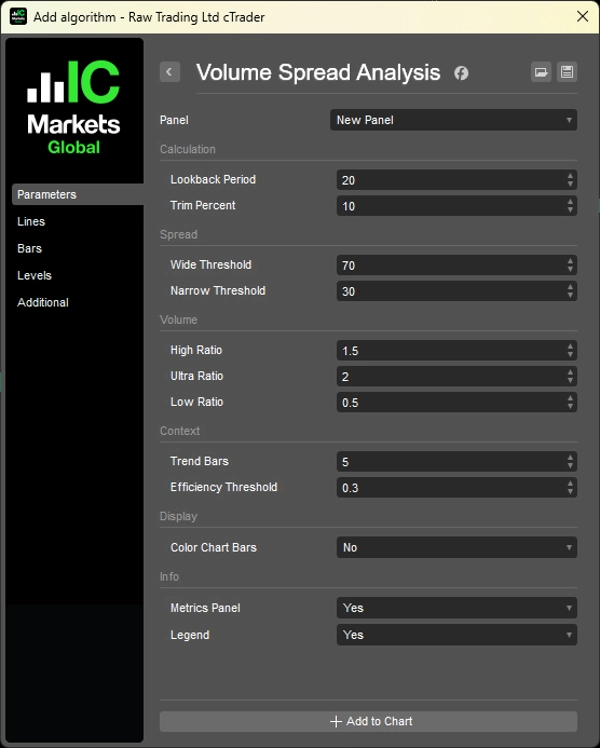
ПАРАМЕТРЫ
1. Расчет
- Период обратного отсчета (20): Бары, используемые для статистики объема/диапазона
- Процент усечения (10%): Удаляет выбросы из расчета объема
2. Классификация диапазона
- Порог широкого диапазона (70%): Процентиль для классификации как "широкий"
- Порог узкого диапазона (30%): Процентиль для классификации как "узкий"
3. Классификация объема
- Высокое отношение (1.5x): Порог выше среднего
- Ультра отношение (2.0x): Порог ультра высокого объема
- Низкое отношение (0.5x): Порог ниже среднего
4. Контекст
- Бары тренда (5): Бары назад для сравнения направления тренда
- Порог эффективности (0.3): Минимум для "сильной" эффективности
5. Отображение
- Окраска баров графика: Применять цвета паттернов к ценовому графику
- Панель метрик: Показывать метрики в реальном времени
- Легенда: Показывать справочник по паттернам
КАК ИСПОЛЬЗОВАТЬ
1. Не используйте паттерны как прямые торговые сигналы — они указывают на потенциальный контекст, а не на входы.
2. Сочетайте с ценовой структурой — VSA лучше всего работает, подтверждая то, что показывает ценовая структура.
3. Следите за контекстом — один и тот же паттерн может означать разные вещи на поддержке и сопротивлении.
4. Важно учитывать объем — поглощение высокого объема на ключевом уровне важнее случайного поглощения бара.
Ограничение объема на Forex
Спотовый рынок Forex показывает тик-объем (количество изменений цены), а не фактическое количество сделок. Паттерны могут быть менее надежными, чем на фьючерсах/акциях с реальными данными объема.
ЛЕГЕНДА (Встроенный справочник)
Включите параметр "Легенда", чтобы отображать описания паттернов прямо на графике.
__________________________________________________________________________________________
БОЛЬШЕ БЕСПЛАТНЫХ ИНДИКАТОРОВ
Изучайте широкий спектр инструментов анализа рынка — от структуры и объема до регрессии, волатильности и пользовательских таймфреймов.
Исходный код доступен в репозитории на GitHub repository.
Все бесплатно для использования. Но если хотите поддержать кофе, можете сделать это здесь.
Поддержка/Сопротивление
Объем
- Volume Activity Profiler
- Volume Efficiency Analyzer
- Volume Profile Analytics
- Volume Profile - Updated
- Volume Spread Analysis
- VWAP (Volume Weighted Average Price)
Скользящие Средние
- SSL Channel
- Anchored Moving Average
- Deviation-Scaled Moving Average
- Gann High Low Activator
- Instantaneous Trendline
- Kaufman Adaptive MA with Trend Vision
- Moving Average Channel
- Moving Averages Suite
- Trend Channel Moving Average
Утилиты/Пользовательские
На основе регрессии
Волатильность
Осцилляторы
__________________________________________________________________________________________
ОТКАЗ ОТ ОТВЕТСТВЕННОСТИ
Торговля связана с риском. Этот индикатор предназначен только для технического анализа — всегда применяйте надлежащее управление рисками и торгуйте ответственно.
ОБРАТНАЯ СВЯЗЬ И УЛУЧШЕНИЯ
Если у вас есть предложения, запросы функций или идеи для улучшения, пожалуйста, оставьте комментарий во вкладке Обсуждение. Ваш отзыв помогает улучшить индикатор для всех.
Сводка
This implementation quantifies VSA concepts using statistical methods, including an efficiency metric defined as (close - open) / range, trimmed mean volume averaging, and percentile ranking for spread. It identifies several bar patterns: Standard (bullish/bearish), Climax (buying/selling exhaustion), Weak (No Demand/No Supply), Absorption (one side winning), and ENR (Effort No Result), each indicating different market conditions.
The indicator displays a volume histogram colored by detected pattern type and provides a real-time metrics panel showing volume ratio, spread percentile, efficiency, and current pattern. Parameters allow customization of lookback periods, volume/spread thresholds, and display options such as coloring chart bars and showing a pattern legend.
VSA is applicable across markets including Forex, stocks, indices, commodities, and crypto. Note that Forex volume reflects tick volume, which may affect pattern reliability. The indicator is designed as an analytical tool to complement price structure analysis rather than as standalone trade signals.
Отзывы покупателей
5 | 100 % | |
4 | 0 % | |
3 | 0 % | |
2 | 0 % | |
1 | 0 % |


