
Описание
ОБЗОР
Основа: Принципы Уайкоффа
Этот индикатор построен на двух взаимодополняющих концепциях методологии Уайкоффа:
1. Усилие против результата
Основной принцип Уайкоффа гласит, что движение цены (результат) должно быть пропорционально объему, стоящему за ним (усилию). Когда усилие и результат находятся в гармонии, рынок ведет себя нормально. Когда они расходятся, это сигнализирует о возможных точках разворота или силе продолжения.
Этот индикатор напрямую реализует это через Эффективность (результат на единицу усилия) и ее обратную величину, Поглощение (усилие, не приводящее к результату).
2. Анализ спреда
Уайкофф также подчеркивал важность анализа характера отдельных ценовых баров — изучение спреда (диапазона), где цена закрылась в этом диапазоне и показывал ли бар решимость или нерешительность.
Этот индикатор реализует анализ спреда через Убежденность (направленная решимость), Коэффициент потерь (откат внутри бара) и Позицию закрытия (используется для контекстуализации поглощения как накопления или распределения).
ЧТО ДЕЛАЕТ ЭТОТ ИНДИКАТОР
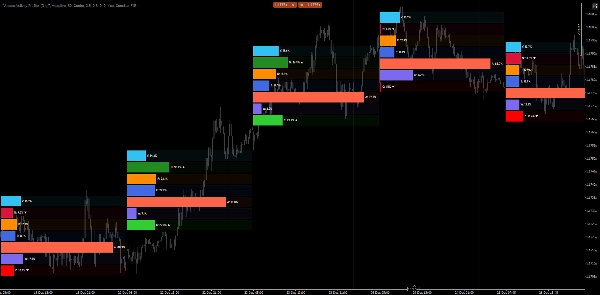
Volume Activity Profiler анализирует ценовые бары выбранного таймфрейма и разбивает их активность на измеримые компоненты. Он вычисляет как исходные метрики, так и производные метрики на основе процентилей, затем отображает их в виде горизонтальных графиков под каждым проанализированным баром.
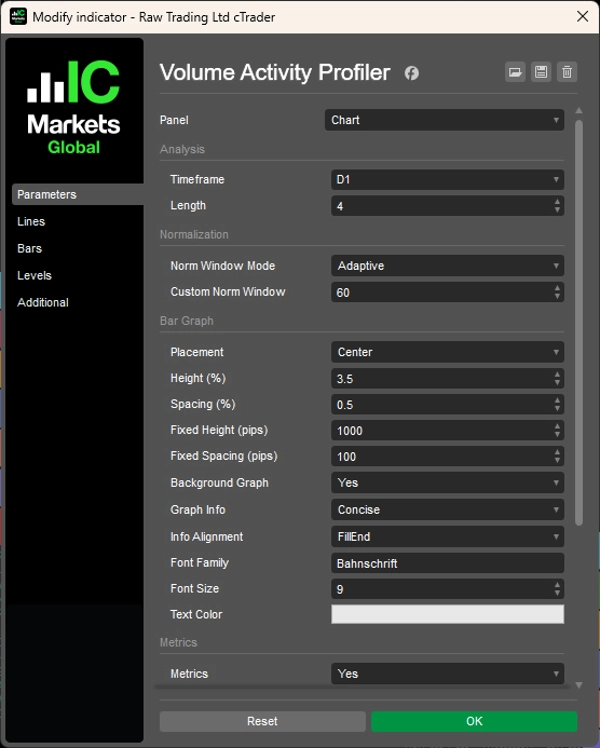
Вы настраиваете два основных параметра:
- Таймфрейм: Таймфрейм для анализа (например, Weekly, Daily, H4)
- Длина: Сколько баров профилировать (например, последние 4 бара)
Затем индикатор профилирует каждый бар в этом диапазоне, вычисляя метрики и ранжируя их относительно друг друга и исторических норм.
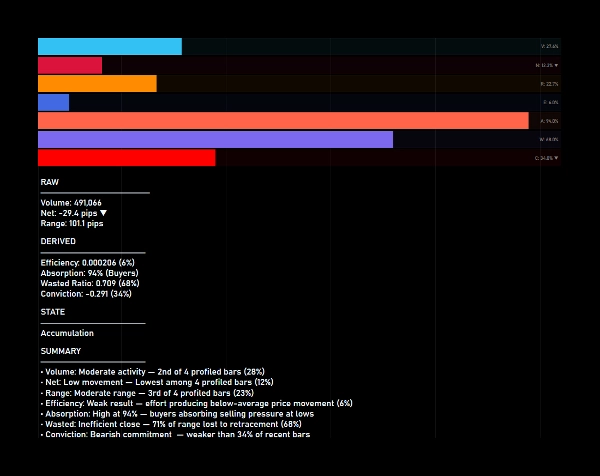
ОБЪЯСНЕНИЕ МЕТРИК
Исходные метрики (пропорциональные среди профилируемых баров):
1. Объем
Тиковый объем бара. Показывает, какую долю от общего профилируемого объема занимает этот бар.
2. Чистое движение
Направленное движение (закрытие − открытие) в пунктах. Показывает долю от общего чистого движения. Цвет указывает направление (зеленый = бычье, красный = медвежье).
3. Диапазон
Общий ценовой диапазон (максимум − минимум) в пунктах. Показывает долю от общего диапазона среди профилируемых баров.
Производные метрики (на основе процентилей относительно исторического окна):
1. Эффективность (Усилие против результата)
Диапазон, произведенный на единицу объема. Высокая эффективность означает, что усилие преобразуется в движение цены. Низкая эффективность указывает на поглощение или сопротивление.
2. Поглощение (Усилие против результата)
Обратное значение эффективности. Высокое поглощение указывает, что объем поглощается без пропорционального движения цены — потенциальное накопление или распределение.
3. Потери (Анализ спреда)
Процент диапазона, потерянный из-за отката (диапазон − чистое движение) / диапазон. Высокие потери означают, что бар отдал большую часть своего движения. Низкие потери указывают на чистый, направленный бар.
4. Убежденность (Анализ спреда)
Направленная решимость, измеряемая как чистое движение/диапазон. Высокая убежденность означает, что бар закрылся близко к своему экстремуму. Низкая убежденность указывает на нерешительность или отторжение.
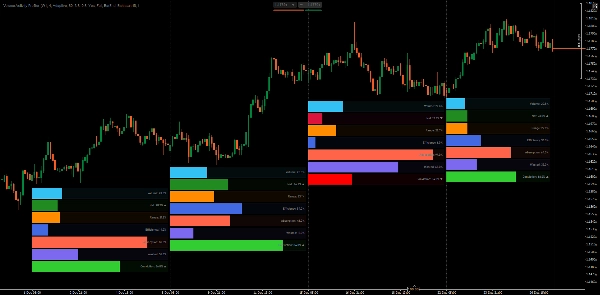
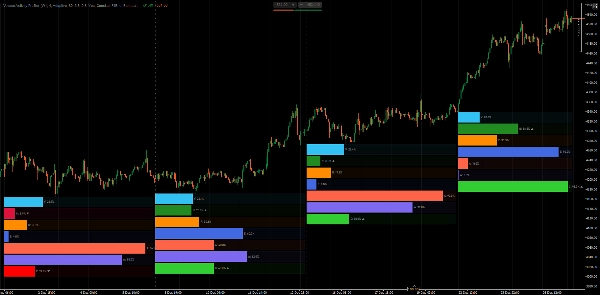
ПОНИМАНИЕ ГОРИЗОНТАЛЬНЫХ ГРАФИКОВ
Каждый профилируемый бар отображает 7 горизонтальных полос:
- Объем, Чистое движение, Диапазон — Заполняются на основе пропорции среди профилируемых баров
- Эффективность, Поглощение, Потери, Убежденность — Заполняются на основе ранга процентиля относительно исторических данных
Бар, заполненный на 80% по Эффективности, означает, что эффективность этого бара выше, чем у 80% баров в окне нормализации.
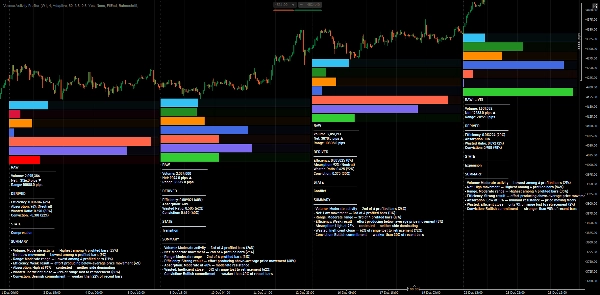
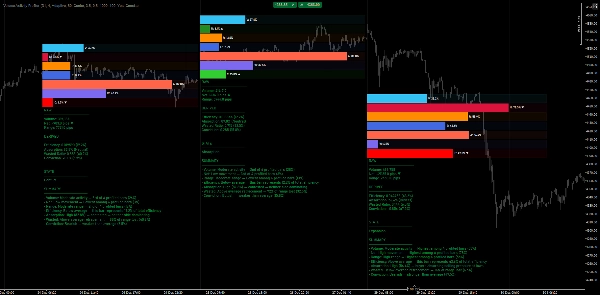
КЛАССИФИКАЦИЯ СОСТОЯНИЙ АКТИВНОСТИ
Когда отображение метрик включено, индикатор классифицирует каждый бар в одно из следующих состояний:
1. Сжатие
Низкая эффективность + низкая убежденность — цена скручивается, потенциальная энергия накапливается
2. Расширение
Высокая эффективность + высокая убежденность + низкие потери — сильное направленное движение
3. Конфликт
Высокие потери + низкая убежденность — борьба между покупателями и продавцами
4. Накопление
Высокое поглощение + закрытие близко к минимумам — покупатели поглощают давление продаж
5. Распределение
Высокое поглощение + закрытие близко к максимумам — продавцы поглощают давление покупок
6. Отторжение
Высокая убежденность, но закрытие в противоположном направлении — неудачное движение, потенциальный разворот
7. Переход
Смешанные сигналы — рынок находится в переходном состоянии между состояниями
ПРАКТИЧЕСКИЕ ПРЕИМУЩЕСТВА
- Быстрая оценка усилия против результата — Мгновенно видите, производит ли объем пропорциональное движение или поглощается.
- Анализ структуры на нескольких таймфреймах — Анализируйте бары более высокого таймфрейма, оставаясь на вашем таймфрейме исполнения.
- Определение накопления/распределения — Высокое поглощение с позицией закрытия показывает, где могут быть активны крупные игроки.
- Обнаружение истощения и отторжения — Высокая убежденность с противоположной позицией закрытия предупреждает о потенциальных разворотах.
- Объективное сравнение баров — Рейтинги и процентильные значения устраняют субъективность в оценках "высокого" или "низкого" объема.
- Подтверждение пробоев — Состояние расширения с высокой эффективностью и убежденностью подтверждает реальный интерес к пробою.
ТИКОВЫЙ ОБЪЕМ КАК ПРОКСИ УСИЛИЯ
Этот индикатор использует тиковый объем в качестве входного параметра усилия. В форекс тиковый объем отражает частоту изменения цены, а не фактический объем сделок — известное ограничение децентрализованных рынков.
Несмотря на это, тиковый объем эффективно служит прокси усилия, потому что:
- Он отражает относительную активность рынка между барами
- Высокое количество тиков указывает на повышенное участие участников
- Соотношение усилия и результата сохраняется — высокая активность с малым движением все равно сигнализирует о поглощении
Процентильные ранги и сравнения баров индикатора остаются валидными, пока данные последовательны.
ПРИМЕЧАНИЯ
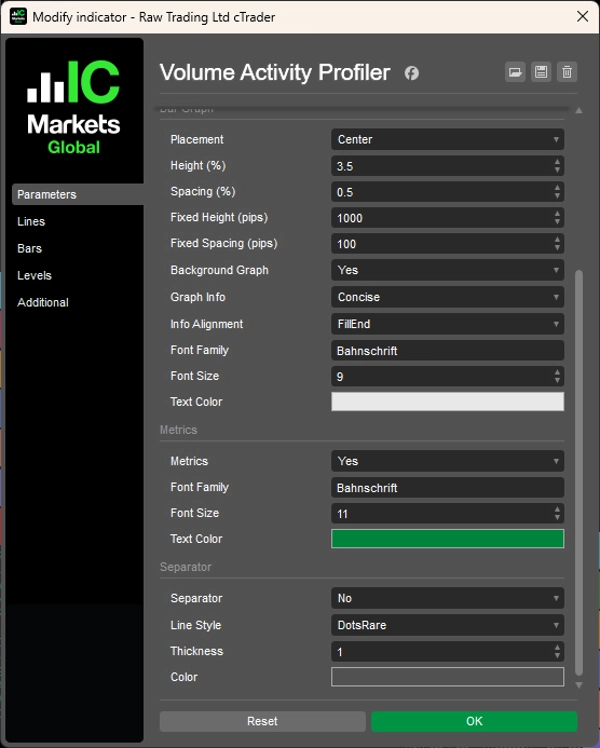
- Индикатор использует адаптивные окна нормализации на основе таймфрейма при установке в режим Adaptive, обеспечивая релевантный исторический контекст.
- Вычисления процентилей обновляются только на завершенных барах, чтобы избежать нестабильных показаний на формирующихся барах.
- Текущий формирующийся бар отмечен [LIVE] в панели метрик.
__________________________________________________________________________________________
БОЛЬШЕ БЕСПЛАТНЫХ ИНДИКАТОРОВ
Изучите широкий спектр инструментов анализа рынка — от структуры и объема до регрессии, волатильности и пользовательских таймфреймов.
Исходный код доступен в репозитории на GitHub repository.
Все бесплатно для использования. Но если хотите поддержать автора кофе, можете сделать это здесь.
Поддержка/Сопротивление
Объем
- Volume Activity Profiler
- Volume Efficiency Analyzer
- Volume Profile Analytics
- Volume Profile - Updated
- Volume Spread Analysis
- VWAP (Volume Weighted Average Price)
Скользящие средние
- SSL Channel
- Anchored Moving Average
- Deviation-Scaled Moving Average
- Gann High Low Activator
- Instantaneous Trendline
- Kaufman Adaptive MA with Trend Vision
- Moving Average Channel
- Moving Averages Suite
- Trend Channel Moving Average
Утилиты/Пользовательские
На основе регрессии
Волатильность
Осцилляторы
__________________________________________________________________________________________
ОТКАЗ ОТ ОТВЕТСТВЕННОСТИ
Торговля связана с риском. Этот индикатор предназначен только для технического анализа — всегда применяйте надлежащее управление рисками и торгуйте ответственно.
ОБРАТНАЯ СВЯЗЬ И УЛУЧШЕНИЯ
Если у вас есть предложения, запросы на функции или идеи для улучшения, пожалуйста, оставьте комментарий на вкладке Обсуждение. Ваш отзыв помогает улучшить индикатор для всех.
Сводка
The indicator profiles price bars over a user-selected timeframe and length, calculating raw metrics such as Volume (tick volume proportion), Net (directional price movement), and Range (price range). It also derives percentile-based metrics including Efficiency (price movement per volume unit), Absorption (volume without proportional price change), Wasted Ratio (retracement within the bar), and Conviction (directional commitment).
These metrics are visually represented as horizontal bar graphs beneath each analyzed bar, facilitating objective comparison and historical context. The indicator classifies bars into activity states like Compression, Expansion, Conflict, Accumulation, Distribution, Rejection, and Transition, aiding in identifying market phases and potential turning points.
Volume Activity Profiler uses tick volume as an effort proxy, reflecting relative market activity. It supports multi-timeframe analysis and updates percentile rankings on completed bars to ensure stable readings. This tool assists traders in assessing volume efficiency, spotting accumulation/distribution, confirming breakouts, and understanding market structure through quantitative volume and price bar analysis.
Отзывы покупателей
5 | 100 % | |
4 | 0 % | |
3 | 0 % | |
2 | 0 % | |
1 | 0 % |


![Логотип продукта "[Hamster-Coder] Pivot Points MTF"](https://cdn.ctrader.com/image/webp/4c143e5a-309c-40e3-a578-f04d1e133ffa_31159)


