
Opis
Oblicz poziomy wsparcia i oporu za pomocą pięciu profesjonalnych metod pivot na dowolnym interwale czasowym.
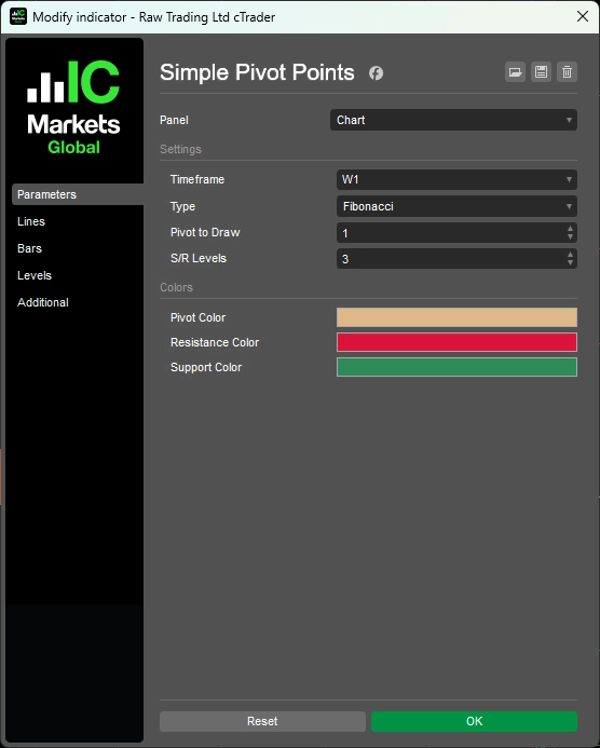
Automatycznie generuje poziomy pivot (Standard, Fibonacci, Woodie, Camarilla, DeMark) od danych M5 do miesięcznych z wyświetlaniem ograniczonym czasowo dla każdego okresu.
Pięć algorytmów obliczeniowych z różną logiką rozmieszczenia S/R, konfigurowalne poziomy wsparcia/oporu (0-6 na stronę), wyświetlanie historycznych pivotów dla wielu poprzednich okresów, automatycznie oznaczone linie (PP, R1-R6, S1-S6) oraz wizualizacja kodowana kolorami zapewniają analizę pivot na poziomie instytucjonalnym dla traderów celujących w kluczowe poziomy cenowe i odwrócenia intraday.
CECHY
Pięć metod obliczeniowych
- Standard: Klasyczna formuła floor trader — najczęściej obserwowane pivoty na świecie
- Fibonacci: Używa stosunków Fib (38,2%, 61,8%, 100%, 138,2%, 161,8%) do rozmieszczenia S/R
- Woodie: Silnie waży cenę zamknięcia — bardziej reaktywny na ostatnie ruchy cen
- Camarilla: Ścisłe poziomy intraday z użyciem mnożników 1,1/12 — popularne w skalpowaniu
- DeMark: Warunkowa formuła oparta na relacji zamknięcia do otwarcia — tylko 1 poziom S/R, ale bardzo ceniona
Pełna personalizacja
- Dowolny interwał: Obliczaj na podstawie danych M5, H1, H4, Dziennych, Tygodniowych, Miesięcznych
- Historyczne pivoty: Wyświetlaj do wielu poprzednich okresów (np. ostatnie 3 tygodnie pivotów)
- Konfigurowalne poziomy: Wyświetlaj 0-6 poziomów wsparcia/oporu na stronę
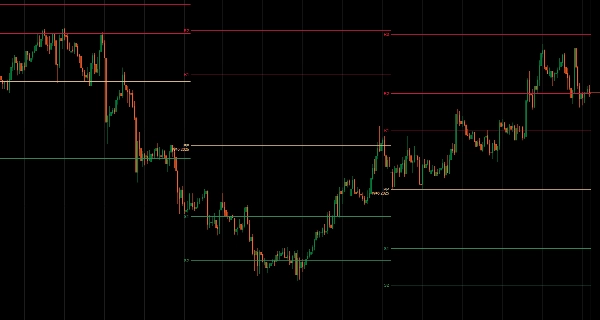
- Automatycznie oznaczone linie: PP, R1-R6, S1-S6 wyraźnie oznaczone
- Linie ograniczone czasowo: Pivoty każdego okresu wyświetlane tylko przez czas trwania tego okresu
- Kodowanie kolorami: Pivot (beżowy), Opór (czerwony), Wsparcie (zielony)
__________________________________________________________________________________________
WIĘCEJ DARMOWYCH WSKAŹNIKÓW
Odkryj szeroki zakres narzędzi analizy rynku — od struktury i wolumenu po regresję, zmienność i niestandardowe interwały czasowe.
Kod źródłowy jest dostępny w repozytorium GitHub repository.
Wszystko dostępne za darmo. Ale jeśli chcesz wesprzeć kawą, możesz to zrobić tutaj.
Wsparcie/Opor
Wolumen
- Volume Activity Profiler
- Volume Efficiency Analyzer
- Volume Profile Analytics
- Volume Profile - Updated
- Volume Spread Analysis
- VWAP (Volume Weighted Average Price)
Średnie kroczące
- SSL Channel
- Anchored Moving Average
- Deviation-Scaled Moving Average
- Gann High Low Activator
- Instantaneous Trendline
- Kaufman Adaptive MA with Trend Vision
- Moving Average Channel
- Moving Averages Suite
- Trend Channel Moving Average
Narzędzia/niestandardowe
Oparte na regresji
Zmienność
Oscylatory
__________________________________________________________________________________________
ZASTRZEŻENIE
Trading wiąże się z ryzykiem. Ten wskaźnik jest przeznaczony wyłącznie do analizy technicznej — zawsze stosuj odpowiednie zarządzanie ryzykiem i handluj odpowiedzialnie.
OPINIE I ULEPSZENIA
Jeśli masz sugestie, prośby o funkcje lub pomysły na ulepszenia, zostaw komentarz na karcie Dyskusja. Twoja opinia pomaga ulepszyć wskaźnik dla wszystkich.
Podsumowanie
Opinie klientów
5 | 100 % | |
4 | 0 % | |
3 | 0 % | |
2 | 0 % | |
1 | 0 % |


