
Descrição
CVD ai
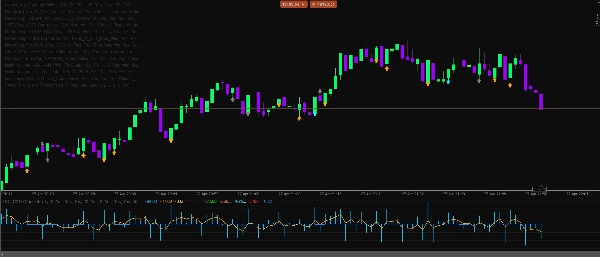
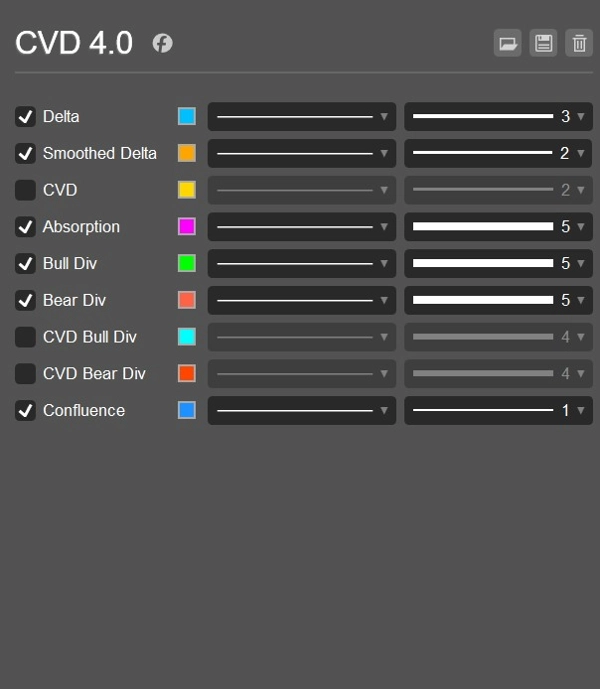
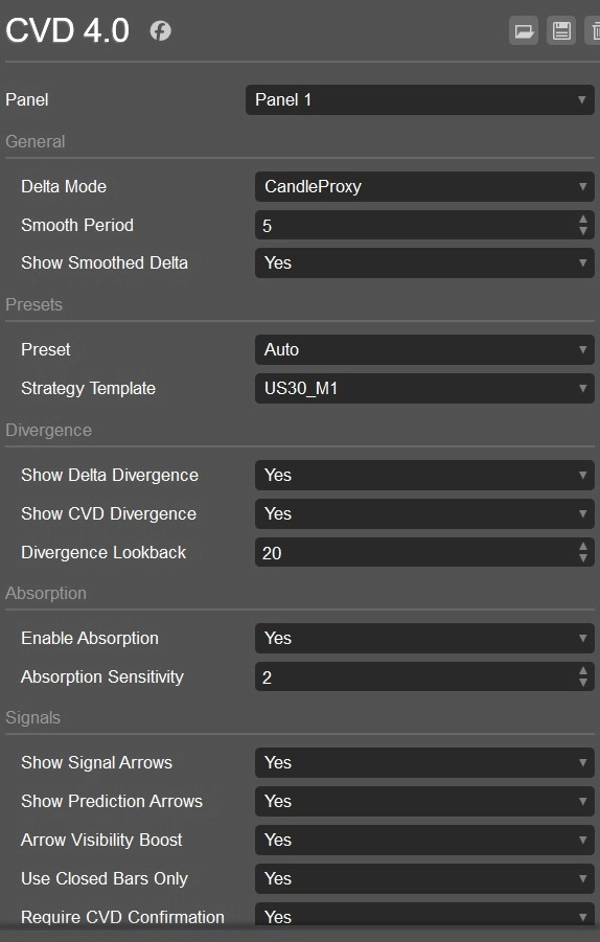
Delta CVD Advanced é um indicador profissional de análise de momentum e ordens, projetado para traders que desejam uma visão mais clara da pressão de compra e venda diretamente a partir do comportamento do mercado. Ele combina Delta, CVD, momentum de ticks ao vivo, absorção, divergência, filtros de sessão, proteções de volatilidade e um motor inteligente de confluência em uma única ferramenta analítica limpa.
Este indicador foi construído para scalping, trading intradiário e confirmação de momentum de curto prazo nos mercados de Forex, Ouro, Índices, Cripto e Petróleo.
Principais Características
- Cálculo Delta ao vivo usando lógica de uptick/downtick
- Modo delta proxy de candle para análise histórica
- Linha de Delta de Volume Acumulado para acompanhar a pressão ao longo do tempo
- Linha Delta suavizada para leitura de momentum mais limpa
- Histograma Delta colorido de Compra/Venda
- Cálculo de momentum baseado em ticks para impulso de mercado ao vivo
- Modo híbrido de momentum combinando inclinação do CVD e impulso de ticks
- Opções de reset do CVD: Nunca, Diário ou por Sessão
- Detecção de divergência Delta de alta e baixa
- Detecção de divergência CVD de alta e baixa
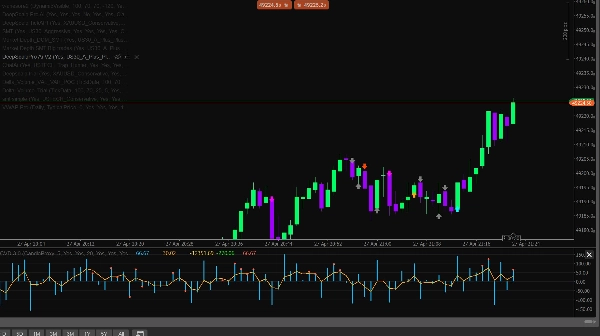
- Detecção de absorção para identificar pressão que não consegue mover o preço
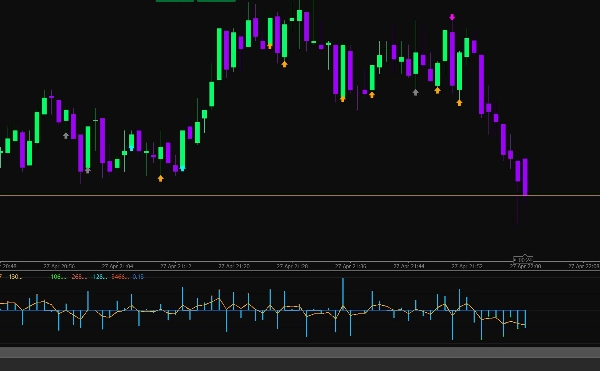
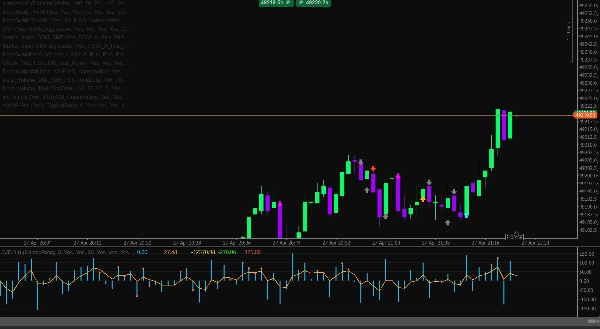
- Setas de sinal para oportunidades de COMPRA e VENDA
- Setas de previsão para alertas antecipados de mudança de momentum
- Confirmação opcional do CVD para sinais
- Motor inteligente de confluência com pontuação direcional
- Filtro de pressão proxy DOM
- Filtro de detecção de varredura para capturas de liquidez
- Filtros de sessão para Ásia, Londres e Nova York
- Detecção automática de sessão usando horário UTC
- Proteção de volatilidade usando limites ATR
- Proteção de spread para evitar condições ruins de mercado
- Filtro de razão de volume para evitar sinais fracos de baixo volume
- Predefinições de símbolos para Forex, Ouro, Índices, Cripto e Petróleo
- Modelos de estratégia para US30 M1, USTECH M1, XAUUSD M1, BTCUSD M1 e Oil M1
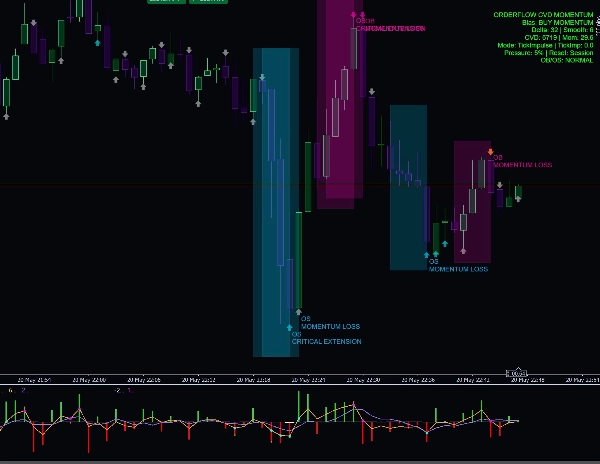
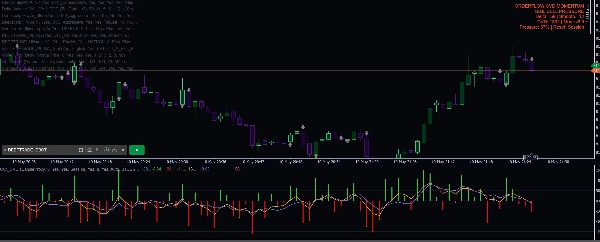
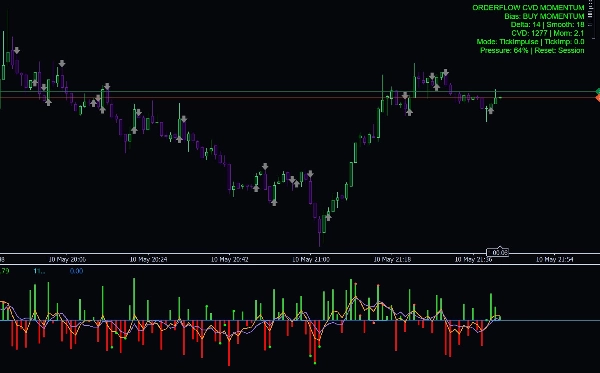
- Painel de informações mostrando viés, Delta, Delta suavizado, CVD, Momentum, porcentagem de pressão e modo de reset
- Alertas de log opcionais com controle de cooldown
Por Que os Traders Usam
Delta CVD Advanced ajuda os traders a entender quem está atualmente no controle: compradores ou vendedores. Em vez de depender apenas das velas de preço, o indicador analisa a pressão por trás do movimento. Isso o torna útil para confirmar entradas, evitar sinais fracos, identificar reversões, detectar absorção e perceber mudanças de momentum antes que se tornem óbvias no preço.
O modo de momentum por ticks é especialmente útil para scalping ao vivo porque reage aos impulsos de preço em tempo real, enquanto as ferramentas de CVD e delta suavizado ajudam a confirmar se o movimento tem força real por trás.
Melhor Usado Para
- Scalping
- Trading intradiário
- Confirmação de momentum
- Confirmação de reversão
- Análise de varredura de liquidez
- Trading de divergência Delta e CVD
- Ouro, Índices, Cripto, Petróleo e pares Forex
- M1, M5 e outros timeframes menores
Aviso Importante
Este indicador é uma ferramenta analítica de suporte à decisão. Não garante lucros e deve ser usado junto com uma gestão de risco adequada, estrutura de mercado e um plano de trading testado.
Resumo
Additional functionalities include detection of bullish and bearish Delta and CVD divergences, absorption detection to identify pressure that fails to move price, and signal arrows for buy/sell opportunities alongside prediction arrows for early momentum shifts. It incorporates session filters for Asia, London, and New York trading sessions, volatility and spread guards, volume ratio filters, and a smart confluence engine with directional scoring.
CVD Ai supports markets such as Forex, Gold, Indices, Crypto, and Oil, and is optimized for scalping, intraday trading, and short-term momentum confirmation on lower timeframes like M1 and M5. It offers strategy templates for specific symbols including US30, USTECH, XAUUSD, BTCUSD, and Oil. The indicator includes an info dashboard displaying bias, Delta, smoothed Delta, CVD, momentum, pressure percentage, and reset mode options.
Avaliações de clientes
5 | 0 % | |
4 | 100 % | |
3 | 0 % | |
2 | 0 % | |
1 | 0 % |


![Logótipo de "[Hamster-Coder] Pivot Points MTF"](https://cdn.ctrader.com/image/webp/4c143e5a-309c-40e3-a578-f04d1e133ffa_31159)


