
Описание
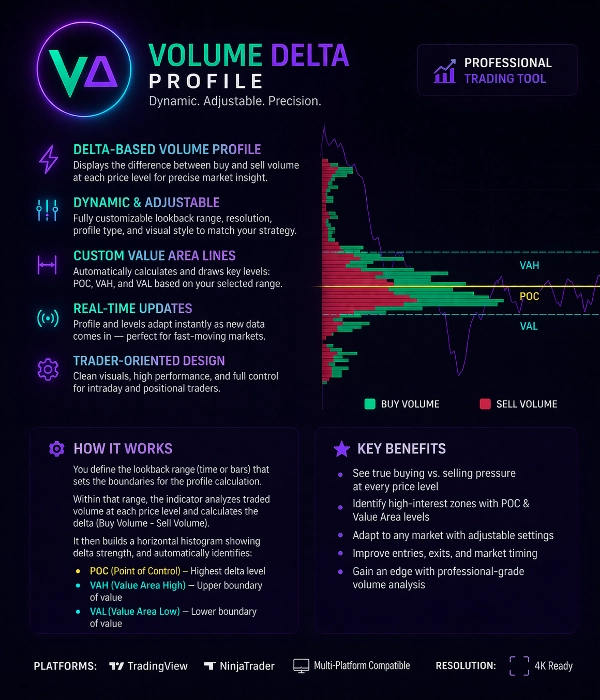
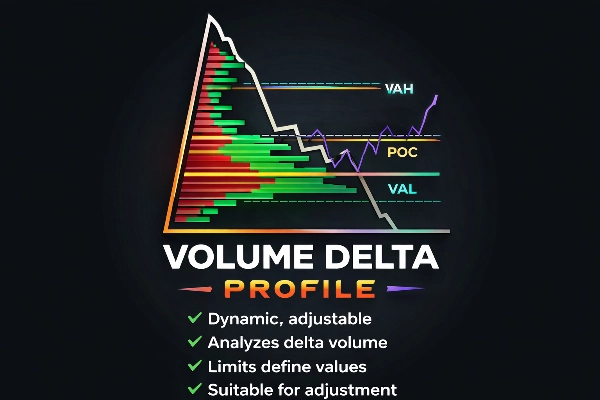
Профиль дельты объема
Профессиональное понимание потока ордеров для продвинутых трейдеров
Профиль дельты объема — это мощный торговый инструмент, предназначенный для выявления истинного баланса между покупателями и продавцами на каждом ценовом уровне.
В отличие от традиционных профилей объема, этот индикатор анализирует дельту объема (объем покупок – объем продаж), чтобы показать, где доминируют агрессивные участники рынка.
Он помогает трейдерам точно определить институциональную активность, зоны поглощения и уровни цен с высоким интересом.
Основные функции
Профиль объема на основе дельты
Индикатор вычисляет дельту объема на каждом ценовом уровне, разделяя:
• Агрессивное давление покупателей
• Агрессивное давление продавцов
Это показывает, кто действительно контролирует рынок.
Динамический и настраиваемый диапазон профиля
Диапазон расчета профиля полностью настраивается.
Пользователи могут определить область расчета с помощью:
• Пользовательского диапазона баров
• Диапазона сессии
• Ручного выбора
• Скользящего динамического диапазона
Профиль автоматически обновляется по мере поступления новых данных.
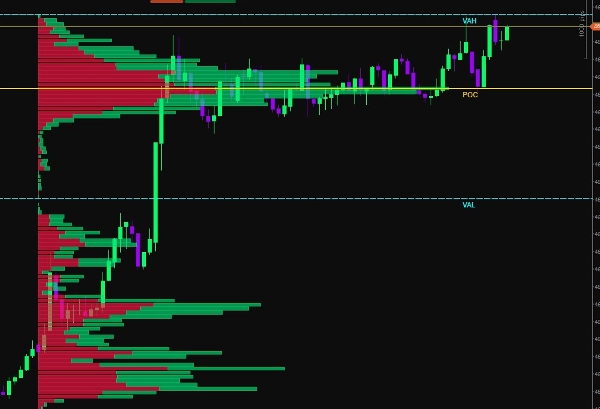
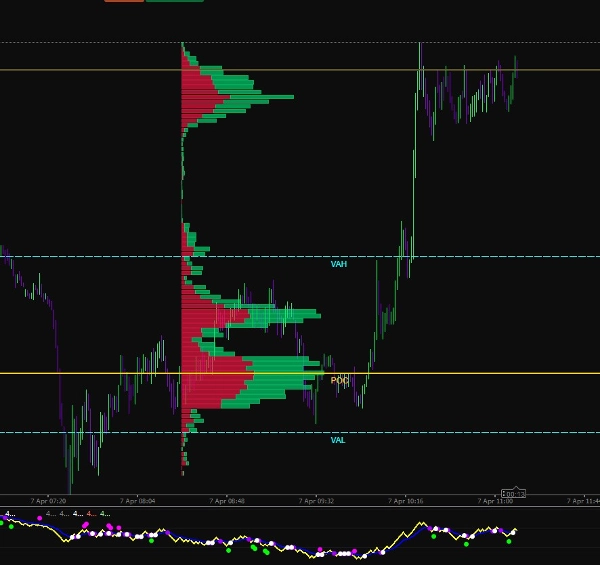
Определение зоны стоимости
Индикатор автоматически вычисляет ключевые уровни структуры рынка:
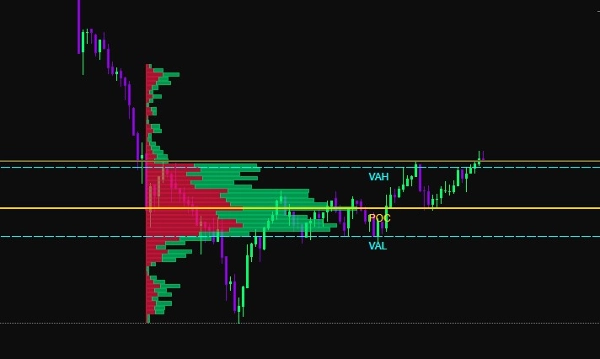
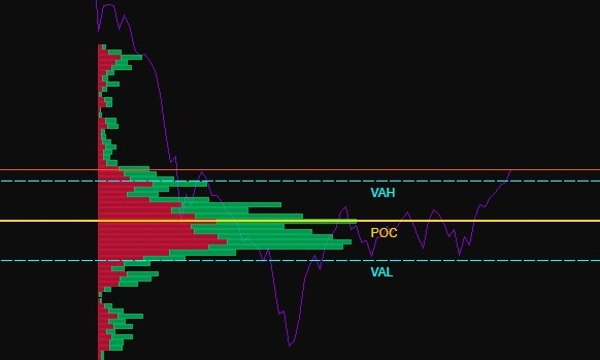
POC (Точка контроля)
Ценовой уровень с наибольшим объемом дельты.
VAH (Верхняя граница зоны стоимости)
Верхняя граница зоны стоимости.
VAL (Нижняя граница зоны стоимости)
Нижняя граница зоны стоимости.
Эти уровни выделяют, где происходила основная активность на рынке.
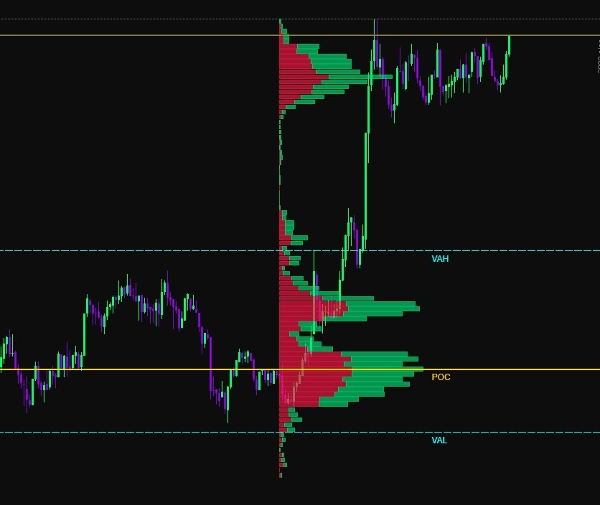
Визуализация покупок и продаж
Объем отображается в виде горизонтальной гистограммы:
Зеленые бары → Доминирующий объем покупок
Красные бары → Доминирующий объем продаж
Это позволяет трейдерам мгновенно видеть:
• Зоны поглощения
• Зоны дисбаланса
• Кластеры ликвидности
• Институциональные следы
Адаптивная визуализация
Индикатор включает множество опций визуальной настройки:
• Регулируемая ширина гистограммы
• Пользовательские цветовые схемы
• Регулируемая прозрачность
• Контроль разрешения
• Масштабируемая отрисовка
Это обеспечивает четкую визуализацию на всех таймфреймах графика.
Умные уровни границ
Индикатор рисует динамические уровни-ориентиры:
• Линия POC
• Линия VAH
• Линия VAL
Эти уровни автоматически обновляются в зависимости от выбранного диапазона профиля и могут использоваться как:
• Уровни поддержки / сопротивления
• Зоны средневозврата
• Уровни подтверждения пробоя
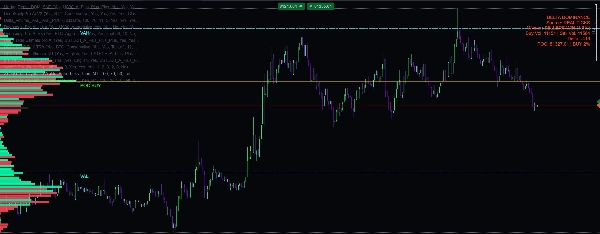
Расчет в реальном времени
Профиль дельты объема непрерывно пересчитывается с использованием данных живого рынка.
Это гарантирует, что трейдеры всегда видят актуальную информацию о потоке ордеров во время быстрых движений рынка.
Сферы применения
Этот инструмент идеально подходит для:
• Скальпинга
• Внутридневной торговли
• Торговли фьючерсами
• Анализа потока ордеров
• Отслеживания ликвидности
• Обнаружения институциональных следов
Ключевые торговые преимущества
✔ Определение реального давления покупателей и продавцов
✔ Обнаружение зон поглощения и истощения
✔ Поиск уровней высокой ликвидности
✔ Повышение точности входа
✔ Подтверждение пробоев или разворотов
✔ Понимание структуры рынка
Технические характеристики
Метод расчета:
Дельта объема = Объем покупок − Объем продаж
Тип профиля:
Горизонтальная гистограмма ценовых уровней
Автоматические уровни:
POC, VAH, VAL
Режим обновления:
Динамическое обновление в реальном времени
Пользовательские настройки:
• Диапазон профиля
• Разрешение гистограммы
• Масштабирование объема
• Настройки цвета
• Видимость уровней
Совместимость с платформами:
Оптимизирован для высокопроизводительной отрисовки графиков
Создан для профессиональных трейдеров
Профиль дельты объема создан для трейдеров, которые хотят выйти за рамки базовых индикаторов и понять реальные механизмы рынка.
Объединяя анализ объема, расчет дельты и структуру зоны стоимости, этот инструмент предоставляет четкое представление об участии на рынке и распределении ликвидности.
Сводка
Users can customize the profile calculation range using options such as custom bar range, session range, manual selection, or rolling dynamic range, with real-time updates as new market data arrives. Key market structure levels—Point of Control (POC), Value Area High (VAH), and Value Area Low (VAL)—are automatically calculated and drawn as dynamic reference lines, useful for support/resistance, mean reversion, and breakout confirmation.
Additional features include adjustable histogram width, color schemes, transparency, resolution control, and zoom-adaptive rendering for clear visualization across all chart timeframes. The tool supports use cases like scalping, intraday trading, futures trading, order flow analysis, liquidity tracking, and institutional footprint detection. It is optimized for high-performance chart rendering and aims to provide traders with precise insights into market participation and liquidity distribution.


![Логотип продукта "[CB] Pivot Points Pro"](https://cdn.ctrader.com/image/webp/43463c82-67b0-4f10-a4ba-901bba091d81_32594)
