
Описание
Дивергенция — один из самых мощных и универсально уважаемых сигналов в трейдинге — и один из самых сложных для постоянного распознавания невооружённым глазом. Divergence Suite Pro автоматизирует весь процесс, одновременно сканируя пять осцилляторов и отображая каждую регулярную и скрытую дивергенцию на вашем графике в реальном времени.
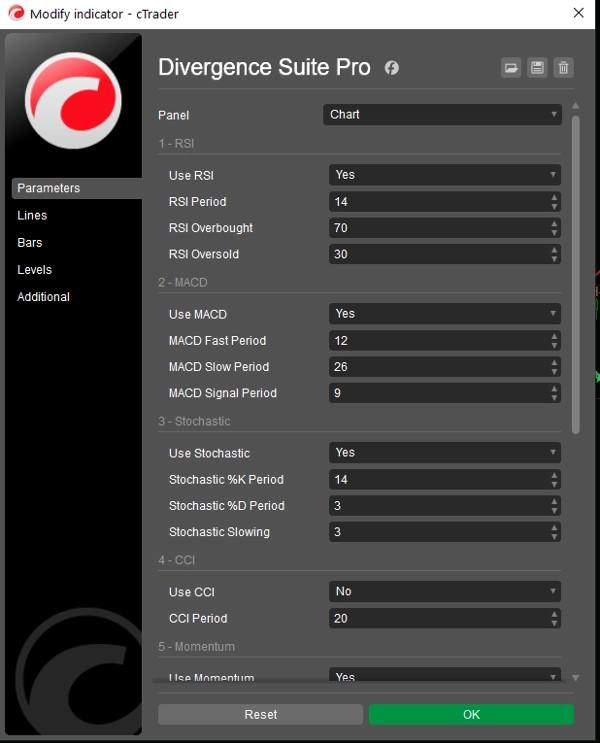
Пять осцилляторов, один индикатор RSI, MACD Histogram, Stochastic, CCI и Momentum сканируются параллельно, каждый полностью настраивается с собственными периодом и пороговыми значениями. Включайте осцилляторы, которым доверяете, отключайте те, которым не доверяете — индикатор полностью адаптируется под ваш стиль торговли.
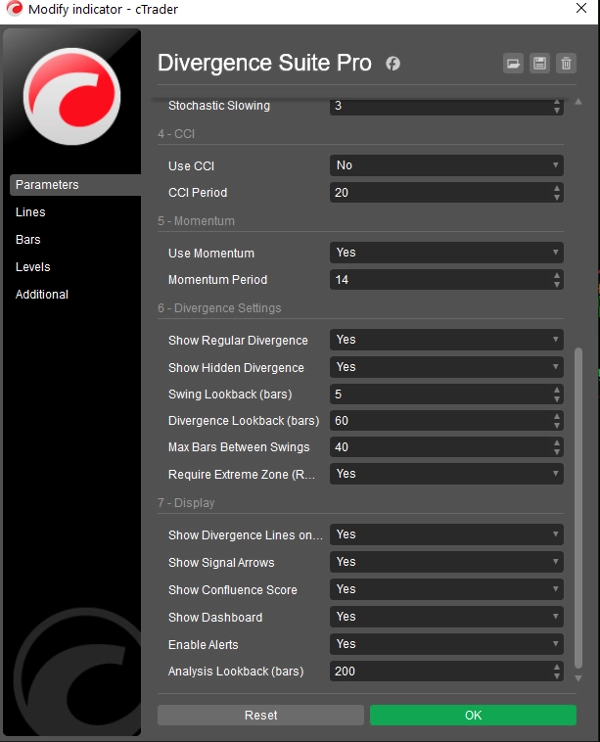
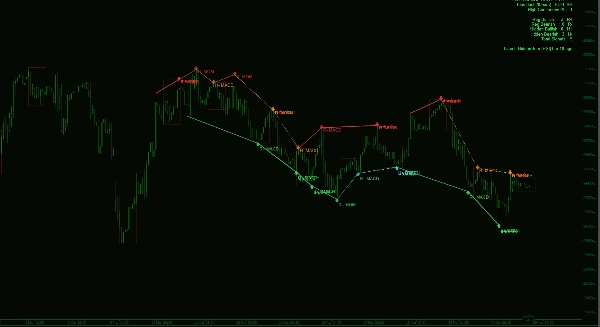
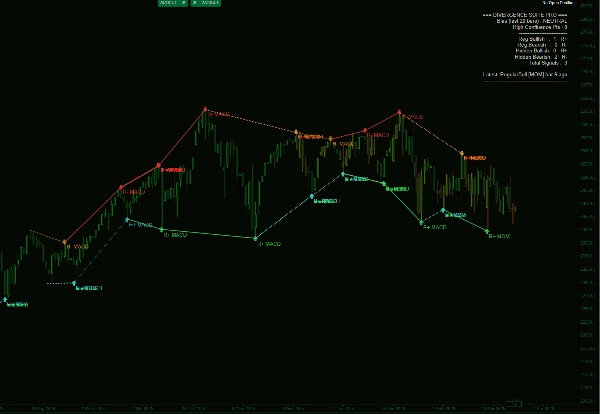
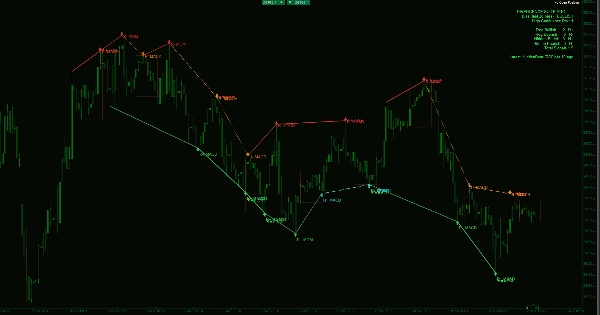
Четыре типа дивергенций Регулярные бычьи и регулярные медвежьи дивергенции выявляют потенциальные развороты тренда до их наступления. Скрытые бычьи и скрытые медвежьи дивергенции подтверждают продолжение тренда во время откатов. Все четыре типа обнаруживаются автоматически и отображаются непосредственно на ценовом графике с чётко обозначенными линиями и направленными стрелками — нет необходимости переключаться между субпанелью и свечами.
Оценка конгруэнтности — выдающаяся функция Когда несколько осцилляторов обнаруживают дивергенцию на одном и том же ценовом колебании, на этой свече отображается рейтинг в виде звёзд. Два осциллятора, согласные между собой, дают две звезды. Все пять — пять звёзд. Эта функция превращает шумный сигнал в фильтр высоковероятных установок — чем больше звёзд, тем сильнее аргумент для сделки.
Живой дашборд Панель в реальном времени отслеживает каждую дивергенцию, обнаруженную за последние 20 баров, разбитую по типам. Рассчитывается оценка смещения на основе баланса бычьих и медвежьих сигналов, а самая последняя подтверждённая дивергенция отображается с указанием расстояния в барах от текущей цены.
Оповещения Каждая новая подтверждённая дивергенция вызывает баннер оповещения на графике и запись в журнал, чтобы вы никогда не пропустили сигнал, даже если отсутствуете у экрана.
Работает на любом инструменте и любом таймфрейме. Форекс, индексы, криптовалюты, сырьё — дивергенция универсальна. Глубина просмотра назад, чувствительность к колебаниям и максимальный разрыв между колебаниями полностью настраиваются, чтобы индикатор можно было точно настроить под ваш инструмент и выбранный таймфрейм.
Сводка
Отзывы покупателей
5 | 67 % | |
4 | 33 % | |
3 | 0 % | |
2 | 0 % | |
1 | 0 % |


