

Описание
ПРОФИЛЬ ОБЪЁМА ПО СВИНГАМ (SVP)
Профиль объёма на основе свингов + Фибоначчи + RSI
--------------------------------------------------
Обнаружение свингов. Профиль объёма. Фибоначчи. RSI. Всё в одном.
--------------------------------------------------
ЧТО ДЕЛАЕТ ЭТОТ ИНДИКАТОР
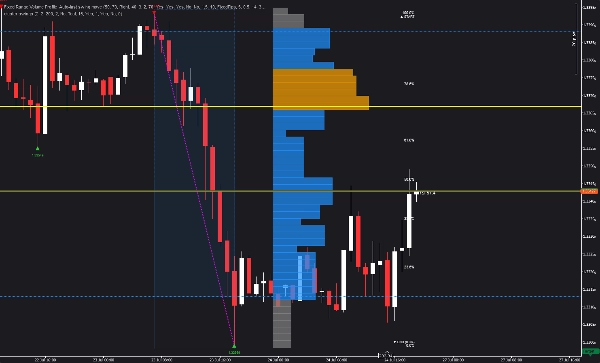
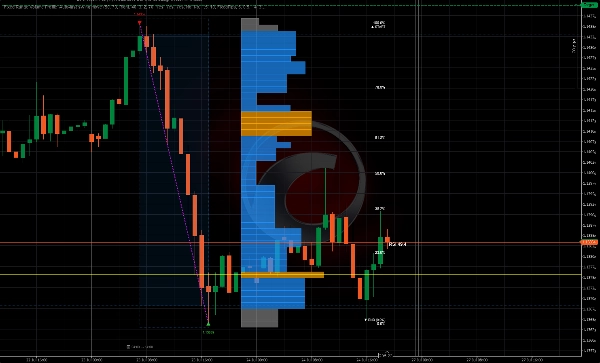
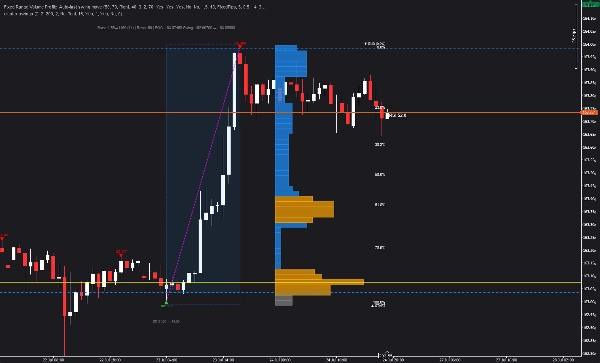
Swing Volume Profile (SVP) автоматически обнаруживает структурные свинги и отображает профиль объёма для последнего завершённого свинга — с наложением уровней Фибоначчи и RSI.
Не требуется ручной выбор диапазона. Индикатор находит свинги и строит профиль автоматически.
--------------------------------------------------
КЛЮЧЕВЫЕ ОСОБЕННОСТИ
- АВТОМАТИЧЕСКОЕ ОБНАРУЖЕНИЕ СВИНГОВ (настраиваемая глубина и отклонение)
- Профиль объёма для последнего завершённого свинга
- Точка контроля (POC) — уровень с наибольшим объёмом
- Зона стоимости (VAH + VAL) — настраиваемый процент
- Узлы с высоким объёмом (HVN) — объём выше среднего порога
- Уровни коррекции Фибоначчи (0, 23.6, 38.2, 50, 61.8, 78.6, 100)
- Наложение RSI рядом с текущей ценой
- Позиционирование гистограммы: слева, справа или рядом со свечами
- Настраиваемое количество рядов (от 10 до 200)
- Настраиваемые цвета и прозрачность
- Продление линий вправо
- Показать/скрыть ценовые метки
- Без перерисовки
--------------------------------------------------
КАК ЭТО РАБОТАЕТ
1. Индикатор обнаруживает свинги с использованием настраиваемой глубины и отклонения
2. Определяется последний завершённый свинг
3. Профиль объёма рассчитывается по диапазону свинга
4. Отображаются POC, VAH, VAL, HVN
5. Накладывается коррекция Фибоначчи на свинг
6. Текущий RSI отображается рядом с ценой
Всё автоматически. Ручной ввод не требуется.
--------------------------------------------------
ВИЗУАЛЬНЫЕ ЭЛЕМЕНТЫ
- Красные треугольники вниз = максимумы свингов
- Зелёные треугольники вверх = минимумы свингов
- Пунктирная пурпурная линия = соединение свингов
- Жёлтая горизонтальная линия = Точка контроля (POC)
- Синие пунктирные линии = Верхняя (VAH) и нижняя (VAL) зоны стоимости
- Оранжевые бары = Узлы с высоким объёмом (HVN)
- Серые бары = Узлы с низким объёмом
- Золотые горизонтальные линии = уровни Фибоначчи
- Белые метки = проценты Фибоначчи
- Значение RSI = текущий RSI рядом с ценой
--------------------------------------------------
ОБЗОР ПАРАМЕТРОВ
НАСТРОЙКИ ПРОФИЛЯ:
- Количество рядов: сколько ценовых рядов (10-200)
- Процент зоны стоимости: % объёма в зоне стоимости (1-100)
ВИЗУАЛЬНЫЕ НАСТРОЙКИ:
- Позиция гистограммы: справа, слева, рядом со свечами или рядом слева
- Ширина гистограммы %: ширина столбцов гистограммы
- Масштабирование ширины столбцов
- Минимальная ширина столбца %
- Прозрачность столбцов (10-100)
ОБНАРУЖЕНИЕ СВИНГОВ:
- Глубина свинга: сколько баров проверять для локальных экстремумов
- Режим отклонения: фиксированные пипсы или на основе ATR
- Фиксированное отклонение: минимальное расстояние в пипсах между свингами
- Множитель отклонения ATR
- Период ATR
- Минимальное количество баров между свингами
ВИЗУАЛЬНО - СВИНГИ:
- Показать линии свингов: включить/выключить пурпурную линию свинга
- Цвет линии свинга
- Показать метки свингов: включить/выключить ценовые метки
- Цвета максимумов/минимумов свингов
ВИЗУАЛЬНО - ФИБОНАЧЧИ:
- Показать коррекцию Фибоначчи: включить/выключить наложение Фибоначчи
- Показать линии Фибоначчи: включить/выключить горизонтальные линии
- Показать метки Фибоначчи: включить/выключить процентные метки
- Цвет линии Фибоначчи / Цвет текста Фибоначчи
ВИЗУАЛЬНО - RSI:
- Показать значение RSI: включить/выключить наложение RSI
- Период RSI
- Цвет метки RSI
ЦВЕТА:
- Цвет POC / Цвет зоны стоимости / Цвет узлов с высоким объёмом / Цвет узлов с низким объёмом
--------------------------------------------------
СЛУЧАИ ИСПОЛЬЗОВАНИЯ
- Определять свинги и распределение объёма в одном окне
- Находить точку контроля (POC) для входов и выходов
- Использовать зону стоимости (VAH/VAL) для целей прибыли
- Выявлять узлы с высоким объёмом (HVN) для ключевых уровней
- Применять коррекцию Фибоначчи к свингу
- Подтверждать сделки с помощью RSI
- Быстро понимать распределение объёма
--------------------------------------------------
ПЕРЕХОД НА STRUCTURAL HEAT ZONES
Этот индикатор показывает свинги и распределение объёма.
Structural Heat Zones идут дальше — они отображают интенсивность участия, принятие и отторжение, а также вовлечённость рынка в нескольких зонах.
Ищите Structural Heat Zones в магазине cTrader.
--------------------------------------------------
ПЕРЕХОД НА INVICTUS EA
Invictus EA использует структурные технологии для выполнения автоматических сделок.
Ищите Invictus в магазине cTrader.
--------------------------------------------------
ТЕХНИЧЕСКИЕ ЗАМЕТКИ
- Индикатор-наложение
- Работает на любом таймфрейме и инструменте
- Без перерисовки (исторический расчёт)
- Оптимизирован для производительности
--------------------------------------------------
ПОДДЕРЖКА
Включены обновления на весь срок службы.
ДЛЯ ПОЛУЧЕНИЯ ДОПОЛНИТЕЛЬНОЙ ИНФОРМАЦИИ — нажмите на профиль разработчика ниже.
Сводка
The indicator identifies swings using configurable parameters such as swing depth and deviation mode (fixed pips or ATR-based), then computes volume distribution within the swing range without requiring manual range selection. Visual elements include colored markers for swing highs and lows, volume nodes, Fibonacci levels, and RSI values, all customizable in terms of color, opacity, and histogram positioning.
Key features include no repainting, configurable rows for volume profile resolution, extendable lines, and toggleable price labels. Use cases focus on identifying swing structures, volume distribution, key price levels, and confluences for trade entries, exits, and profit targets. The indicator is optimized for performance and provides lifetime updates.





























