
LT_SmartSwings
Gösterge
6 satın almalar
Sürüm 1.0, Jun 2025
Windows, Mac
5.0
Değerlendirmeler: 1
Not: Yalnızca cTrader Windows üzerinde test edilmiştir.
LT_SmartSwings, tüccarların önemli dönüş noktalarını, piyasa hareketlerini ve kırılma olaylarını netlik ve esneklikle görselleştirmelerine yardımcı olmak için tasarlanmış güçlü bir salınım tabanlı piyasa yapısı göstergesidir. Hassasiyet ve uyarlanabilirlik için oluşturulan bu araç, salınım mantığına, Fibonacci örtüşmesine ve kırılma analizine dayanan tüccarlar için idealdir.
Temel Özellikler:
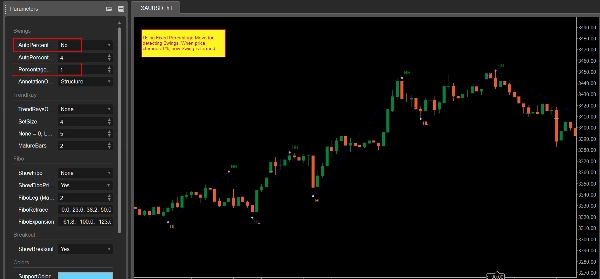
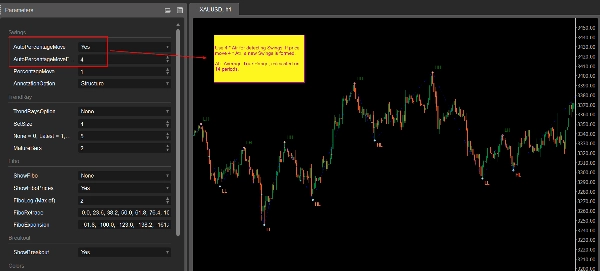
- Salınım Yüksek/Düşük Tespiti fiyat hareket yüzdesine dayalı
- Otomatik veya Manuel Eşik: Sabit % veya otomatik mod kullanın (ATR x faktöre göre)
- ZigZag Çizgisi önemli salınımları bağlar
- Detaylı Açıklamalar 5 mod ile:
-
- Yapı: HH, HL, LH, LL
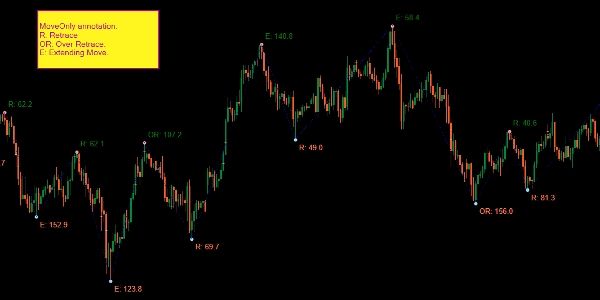
- SadeceHareket: Geri çekilme (R) ve Uzatma (E) yüzdeleri
- SadeceFiyat
- HareketVeFiyat
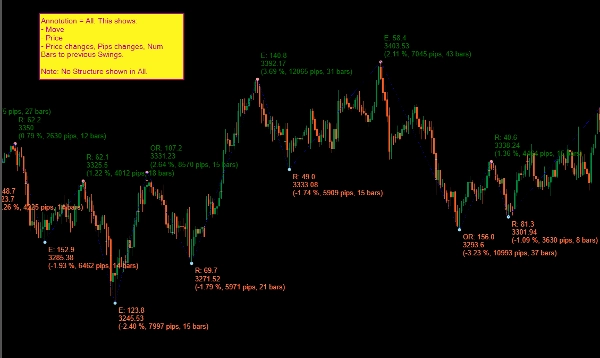
- Hepsi: hareket %, pip, bar, fiyat, hareket türü
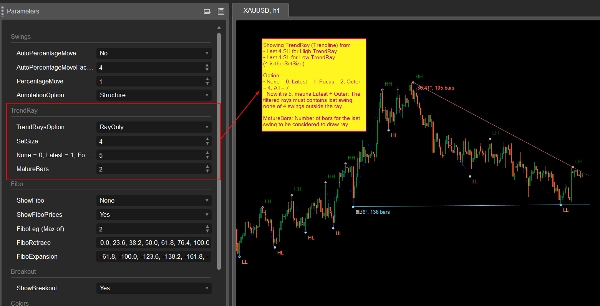
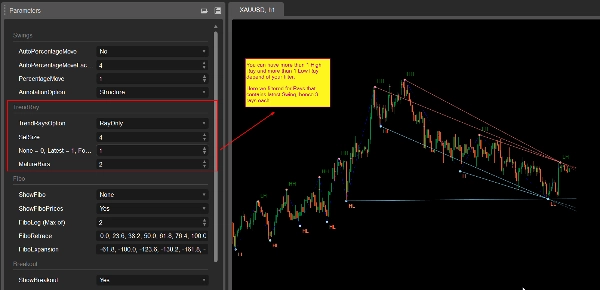
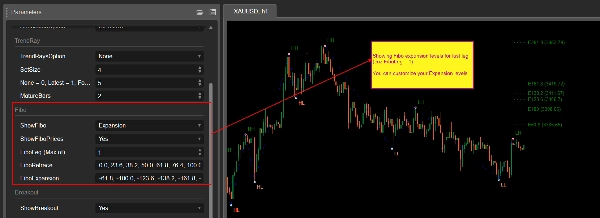
- Trend Işını Projeksiyonu (birden çok filtreleme seçeneği ile):
-
- Akıllı kısıtlamalar kullanarak son salınımlardan ışınlar çizer
- Seçenekler: En son, Odak (eğim), Dış veya Hepsi
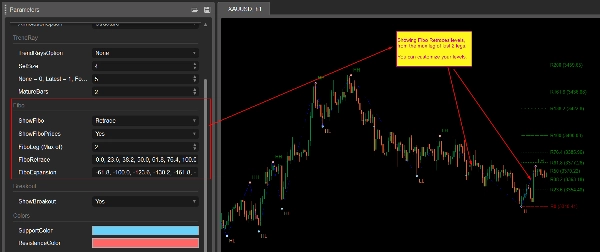
- Otomatik Fibonacci Seviyeleri:
-
- Son hareketlere dayalı Geri çekilme veya Genişleme seviyeleri çizer
- Kullanıcı tarafından yapılandırılabilir seviye setleri
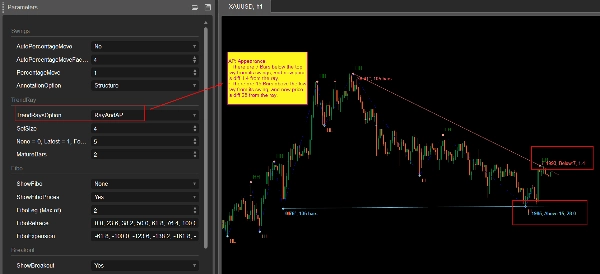
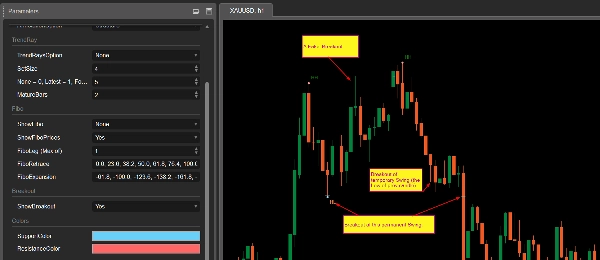
- Kırılma İşaretleme:
-
- Salınım noktalarının kırılmasını algılar (hem onaylanmış hem de sahte kırılmalar)
- Tarihsel referans için kalıcı gösterim
- Renk Özelleştirme destek/direnç çizgileri için
Kullanım Alanları:
- Destek/direnci dinamik olarak tanımlayın
- Salınım yapısını ve geçişleri anlayın
- Fibonacci kullanarak trend devamını veya dönüşünü tespit edin
- Ticaret planlaması için kırılma noktalarını görselleştirin
- Mevcut sistemleriniz veya takdir stratejinizle birleştirin
Önerilen Kullanım:
- Çalışma zaman diliminize ekleyin (örneğin, M30, H1)
- Manuel tüccarlar, yapı analistleri ve onay tabanlı stratejiler için en uygunudur
Lansman Teklifi: Şimdi sadece 15$!
Gösterge profili
5.0
Değerlendirmeler: 1
5 | 100 % | |
4 | 0 % | |
3 | 0 % | |
2 | 0 % | |
1 | 0 % |
Breakout
ATR
cTrader Store üzerinden erişilebilen işlem botları, göstergeler ve eklentiler gibi ürünler, üçüncü taraf sağlayıcılar tarafından sağlanır ve yalnızca bilgilendirme ve teknik erişim amaçlarıyla sunulur. cTrader Store bir broker değildir ve yatırım tavsiyesi, kişisel öneriler vermez veya gelecekteki performansı garanti etmez.


Başlangıç 25/09/2024
34
Satışlar