
FVG & Imbalance Detector
Индикатор
2 покупки
Версия 1.0, Jan 2026
Windows, Mac
4.0
Отзывы: 2
Описание
В мире Smart Money Concepts (SMC) и ICT, дисбалансы цены — это "отпечатки пальцев" крупных институциональных игроков. Когда рынок движется слишком быстро, он оставляет после себя Fair Value Gap (FVG) — зону неэффективности, к которой цена почти всегда возвращается, чтобы "заполнить" или повторно протестировать.
Детектор FVG и дисбалансов для cTrader — это высокопроизводительный инструмент, предназначенный для автоматического обнаружения этих неэффективностей. Больше не нужно рисовать вручную — получайте четкие, действенные зоны прямо на вашем графике.
Почему этот индикатор обязателен к использованию:
- 🚀 Обнаружение институциональных движений: Увидьте, где крупные банки и хедж-фонды вошли на рынок с огромным объемом.
- 🎯 Зоны с высокой вероятностью: Используйте выявленные дисбалансы как магнитные цели для тейк-профитов или как "Золотые зоны" для точных входов.
- 📈 Чистая визуализация: Высококачественные прямоугольные наложения, которые делают анализ тренда легким.
- 🔧 Полная гибкость: В отличие от базовых индикаторов, эта версия позволяет расширять зоны в будущее или корректировать их начальные точки в соответствии с вашей конкретной стратегией.
Эксклюзивные функции:
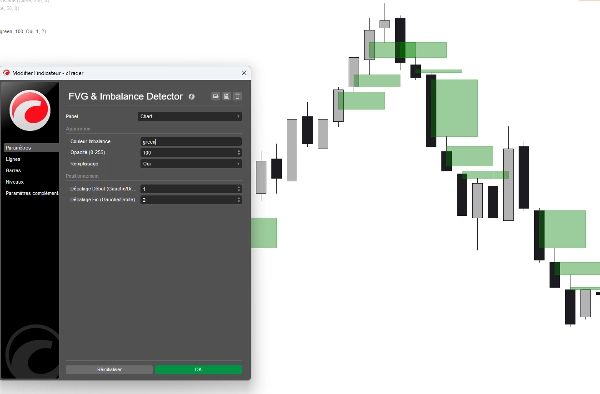
- Умная логика обнаружения: Продвинутый алгоритм точно определяет как верхние (медвежьи), так и нижние (бычьи) неэффективности с пиксельной точностью.
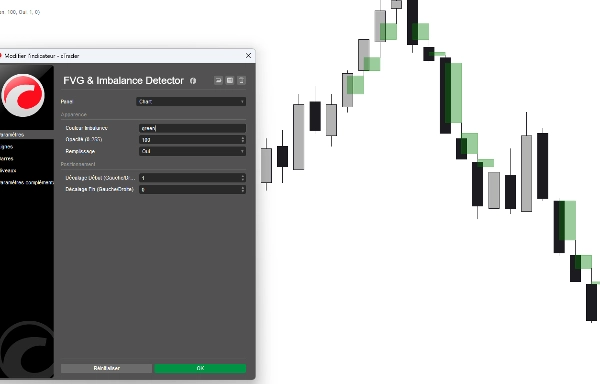
- Двунаправленные смещения: Эксклюзивные параметры смещения "Start" и "End" позволяют проецировать зоны вперед или назад, чтобы увидеть, как исторические разрывы соотносятся с текущим движением цены.
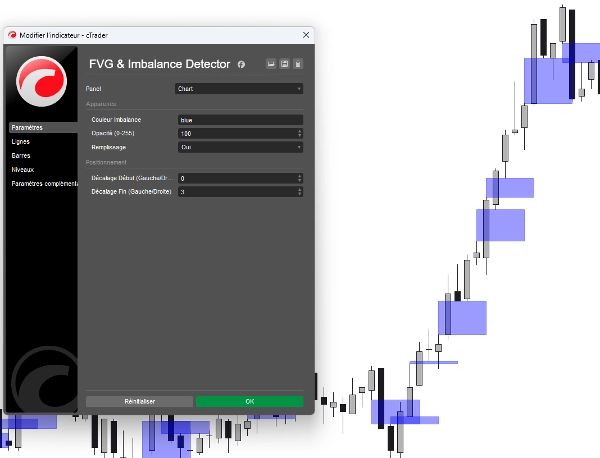
- Профессиональный цветовой интерфейс: Выбирайте предпочитаемый стиль через чистое выпадающее меню (Желтый, Аква, Красный и др.) — больше не нужно вводить шестнадцатеричные коды!
- Контроль прозрачности: Регулируйте прозрачность, чтобы зоны не загромождали ваш обзор ценового движения.
- Оптимизированная производительность: Легкий код, который не замедлит вашу платформу cTrader, даже при работе с несколькими графиками.
Как использовать:
- Определите разрыв: Индикатор рисует прямоугольник там, где возникает дисбаланс между максимумом первой свечи и минимумом третьей.
- Ожидайте повторного теста: Следите за тем, как цена возвращается к этим прямоугольникам.
- Исполните сделку: Ищите паттерны отскока внутри зоны FVG для входов с низким риском и высокой потенциальной прибылью.
Сводка
ИИ-сводка
The FVG & Imbalance Detector is an indicator for the cTrader platform designed to identify Fair Value Gaps (FVG) and price imbalances, key concepts in Smart Money Concepts (SMC) and Institutional Cycle Trading (ICT). These gaps represent zones of market inefficiency created by rapid price moves, often reflecting institutional activity. The indicator automatically detects and highlights these zones on the chart with clear rectangular overlays, eliminating the need for manual drawing.
Key features include detection of both bullish (bottom) and bearish (top) imbalances with high precision, customizable zone extensions via start and end offset parameters, and adjustable opacity and color settings for clear visualization. The tool is optimized for performance to avoid slowing down the platform, even when applied to multiple charts.
Traders can use the indicator to spot where large institutional players have entered the market, identify high-probability zones for entries or take-profits, and monitor price retests of these inefficiency zones for potential trade execution. The indicator supports analysis across various markets including Forex, Indices, Commodities, and Crypto.
Профиль индикатора
Отзывы покупателей
4.0
Отзывы: 2
5 | 0 % | |
4 | 100 % | |
3 | 0 % | |
2 | 0 % | |
1 | 0 % |
Отзывы покупателей
January 18, 2026
tested small first and that felt like the right move, and account protection still comes first.
January 14, 2026
Обсуждение
Частые вопросы
Forex
Indices
Commodities
Crypto
AI
Продукты, доступные в cTrader Store, включая торговых ботов, индикаторы и плагины, предоставляются сторонними разработчиками и доступны исключительно в информационных и технических целях. cTrader Store не является брокером и не предоставляет инвестиционные консультации, персональные рекомендации или какие-либо гарантии будущей доходности.
Больше от этого автора


![Логотип продукта "[Stellar Strategies] MARSI Signal Plotter"](https://cdn.ctrader.com/image/webp/7b2b8da6-8f8e-4646-8d4a-4710c516c01e_25567)


Цена
С 27/10/2025
10
Продажи