
Description
Le concept de « Reverse Engineering »
L'innovation majeure de cet indicateur réside dans son algorithme de Reverse Engineering. Habituellement, un oscillateur stochastique prend des données de prix et les transforme en un nombre entre 0 et 100. Cet indicateur fait l'inverse : il prend les niveaux mathématiques de l'oscillateur et les re-projette sur l'échelle des prix.
Cela permet au trader de traduire un momentum mathématique en un niveau de prix concret ($ ou pips) directement sur le graphique.
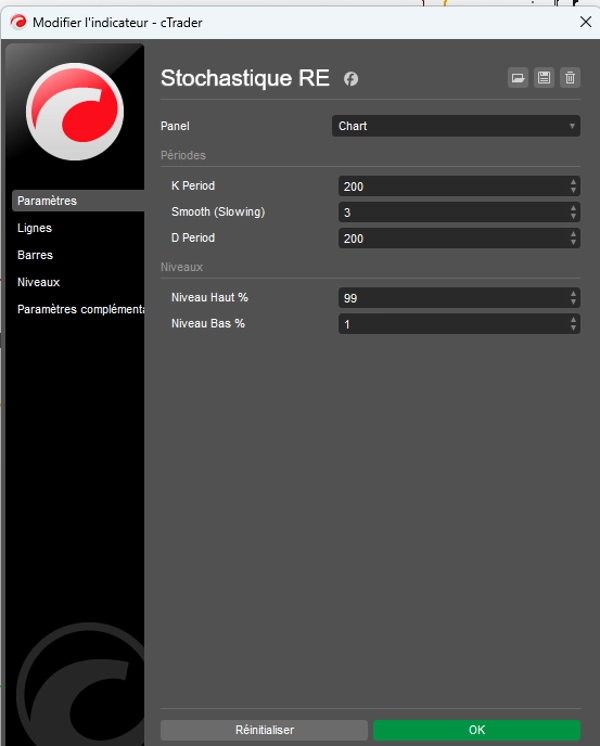
Définir les limites : le plafond (99 %) et le plancher (1 %)
Contrairement aux réglages classiques (80/20), cet indicateur est par défaut réglé à 1 % et 99 %. Cette configuration a un but précis : elle définit les limites physiques du prix.
- Le niveau 99 % (plafond des prix) : Il définit le prix le plus élevé que le marché peut atteindre avant d’être considéré comme ayant épuisé 99 % de son amplitude de mouvement sur la période donnée. C’est la « frontière » du prix.
- Le niveau 1 % (plancher des prix) : Il définit le prix le plus bas, le support ultime du cycle en cours. C’est le niveau où le prix a épuisé 99 % de sa capacité à la baisse par rapport à son histoire récente.
Pourquoi « définit-il le prix » ?
Grâce à ce système, la ligne Orange Signal %D n’est plus simplement une courbe évoluant dans le vide.
- Localisation du prix : Elle montre l’emplacement exact du « prix juste » pondéré par son momentum.
- Cartographie de la fourchette : Elle transforme le graphique en une carte où l’on peut voir si le prix actuel « vaut » 1 % ou 99 % de son potentiel.
- Objectifs concrets : Si la ligne orange monte, ce n’est pas simplement pour atteindre « 80 » ; elle cherche à atteindre le prix précis affiché par la ligne rouge (99 %).
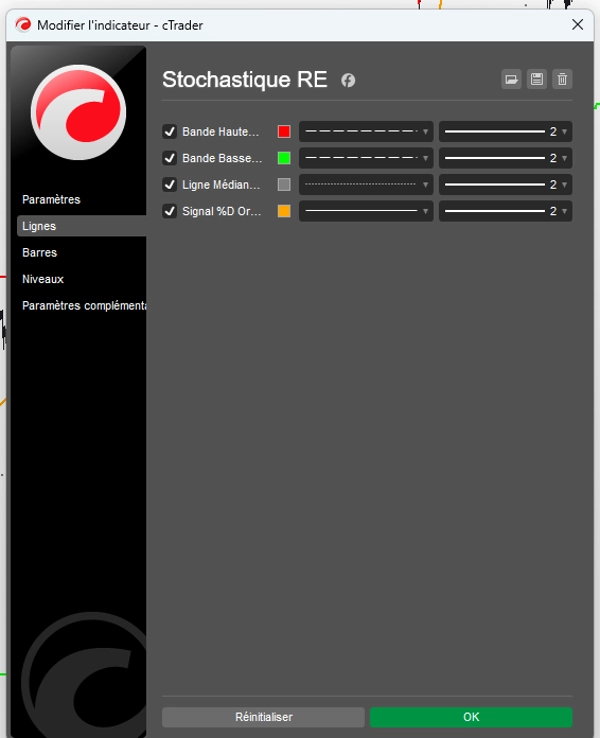
Fonctions des lignes (onglet Lignes)
Tout est personnalisable pour une lecture visuelle instantanée :
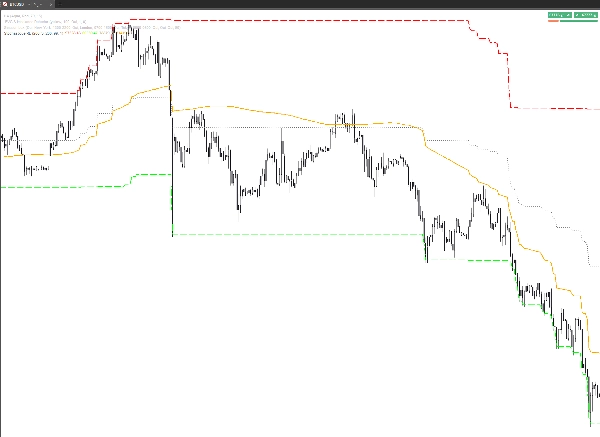
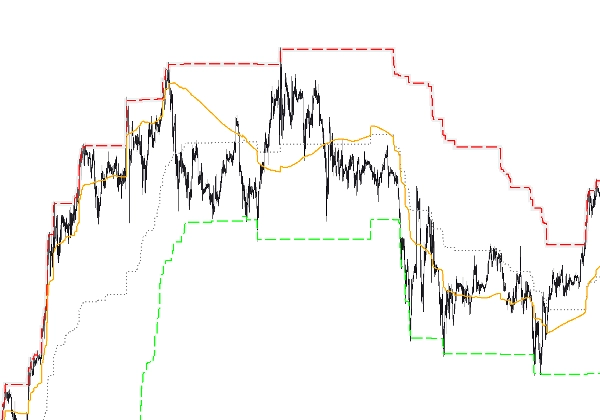
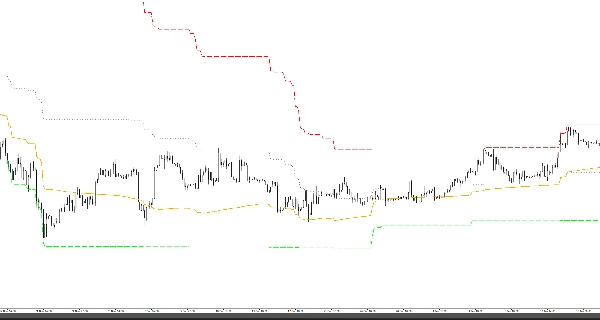
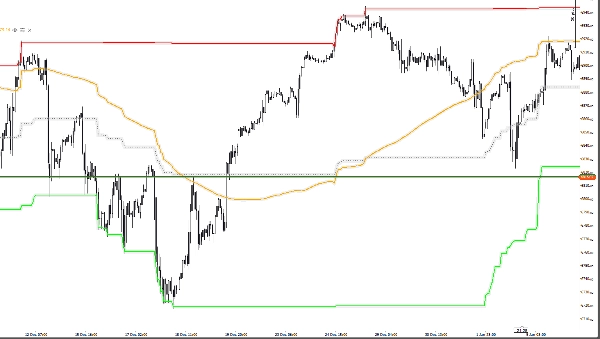
- Bande supérieure (99 %) : Le plafond théorique des prix.
- Bande inférieure (1 %) : Le plancher théorique des prix.
- Ligne médiane (50 %) : Le point pivot central, la zone d’équilibre.
- Orange Signal %D : Le curseur dynamique naviguant entre le plancher et le plafond pour définir la direction du marché.
Résumé pour le trader
Cet indicateur ne vous dit pas simplement que le marché est « suracheté » ; il vous montre à quel prix exact le marché devient physiquement trop cher (99 %) ou trop bon marché (1 %). C’est un outil de précision qui ramène les mathématiques à la réalité du carnet d’ordres.
Résumé
The indicator displays these boundaries directly on the price chart, allowing traders to see exact price levels where the market is considered overbought or oversold. Key features include customizable lines for the upper band (99%), lower band (1%), mid line (50%), and an orange signal %D line that dynamically indicates market direction between these boundaries.
By translating momentum into precise price targets, Stochastique RE helps traders localize fair price zones, map price ranges, and identify concrete price targets rather than abstract oscillator values. It supports various markets including Forex, stocks, commodities, indices, and cryptocurrencies, with symbol tags such as BTCUSD, EURUSD, GBPUSD, XAUUSD, NAS100, and USDJPY.
Avis clients
5 | 67 % | |
4 | 33 % | |
3 | 0 % | |
2 | 0 % | |
1 | 0 % |


