
Mô tả
📈 Chỉ báo này là một công cụ giúp chúng ta xác định và hình dung hướng đi của xu hướng trên biểu đồ giá. 📊 Hoạt động của nó dựa trên việc tính toán các mức xu hướng sử dụng các trung bình động hàm mũ và một phép đo độ biến động để xác định các vùng mà giá dự kiến sẽ di chuyển. Dưới đây, tôi sẽ giải thích chi tiết cách nó hoạt động:
📐 Tính Toán Các Mức Xu Hướng
Chỉ báo bắt đầu bằng cách tính toán cái gọi là "mức cơ sở." Mức này được lấy bằng cách trung bình hai trung bình động hàm mũ: một ngắn hạn (dựa trên độ dài do người dùng định nghĩa, trong trường hợp này là 222) và một dài hạn (gấp đôi độ dài của cái đầu tiên). Các trung bình này cung cấp cho chúng ta một tham chiếu cho xu hướng tổng thể.
Tiếp theo, độ biến động được tính bằng cách sử dụng độ lệch chuẩn của giá đóng cửa, và giá trị này được làm mượt bằng một trung bình động hàm mũ bổ sung. Độ biến động đã làm mượt được nhân với một tham số gọi là "độ nhạy," điều này cho chúng ta các mức trên và dưới quanh mức cơ sở. Các mức này hoạt động như các dải xu hướng và giúp xác định liệu giá đang ở trên hay dưới xu hướng.
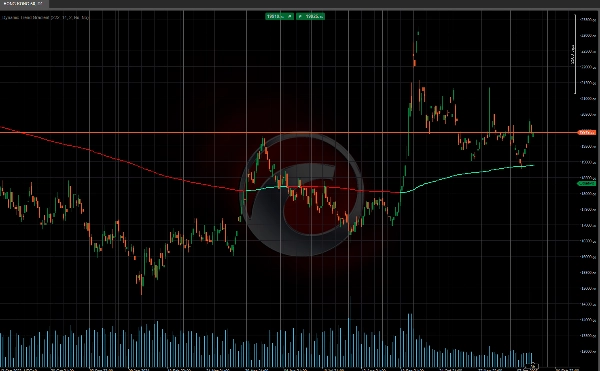
📉📈 Trạng Thái Xu Hướng
Với các mức này đã được tính toán, chỉ báo đánh giá trạng thái xu hướng trên thị trường. Nếu giá nằm trên mức cơ sở, nó giả định một xu hướng tăng 🐂, và nếu giá nằm dưới, xu hướng là xu hướng giảm 🐻. Nếu giá vượt qua các mức trên hoặc dưới, chỉ báo sẽ thay đổi tín hiệu xu hướng, báo hiệu một sự đảo chiều hoặc thay đổi trong động lực thị trường.
Công cụ này hoàn hảo cho các nhà giao dịch muốn đi trước các xu hướng thị trường! 🚀📉📈
Các chỉ báo của Ctrader Store:
Dynamic Market Structure
Phân Tích Các Điểm Quay
Fibonacci Linear
Hồi Quy Đa Khung Thời Gian
Multi-Level Candle Bias
Tracker
Auto Support and
Resistance Trend Lines
Tóm tắt
Đánh giá của khách hàng
5 | 0 % | |
4 | 100 % | |
3 | 0 % | |
2 | 0 % | |
1 | 0 % |


![Logo "High-Low Divergence [Iridio Capital]"](https://cdn.ctrader.com/image/webp/443c4661-7abb-40f1-842f-4b6ec560649b_40914)


