
Mô tả
🚀 Hơn 10.000 nhà giao dịch đã sử dụng các chỉ báo hàng đầu của chúng tôi 🏆
Khám phá lý do tại sao các chuyên gia chọn chúng tôi – những công cụ mạnh mẽ nhất trên cTrader (chỉ báo, thuật toán và cBots) đang chờ bạn.
👉 Nhận tất cả các hệ thống hàng đầu của chúng tôi tại đây:
_______________________________________________
📌 Chỉ báo Cấu trúc Thị trường
· ✅ AdvancedMarket Structure: Bos, Choch, SwinLevels, Order Blocks, Market Structure& Liquidity Finder
· 🔄 Dynamic Market StructureAnalysis of Turning Points
· 🧱 Order Block
· ⚖️ Market Imbalance
· ⛓️ BOS & CHOCH
· 🧠 ICT Power of 3
_______________________________________________
🔚 Hệ thống Thoát Thông minh
· 📍 Thuật toán Thông minh Theo dõi
_______________________________________________
📐 Chỉ báo ZigZag
· 🔍 Dự đoán Thanh khoản Giá ZigZag
· ➖ ZigZag
· 🎯 Bộ Theo dõi Cực điểm Zig-Zag
_______________________________________________
🧱 Chỉ báo Hỗ trợ & Kháng cự
· 🟩 Đường Hỗ trợ & Kháng cự SmartTrend
· 🧱 Tất cả các Mức Hỗ trợ và Kháng cự
_______________________________________________
📊 Chỉ báo Xu hướng & Kênh
· 📊 Supertrend
· ⚡Bộ Phân tích Xu hướng Động lượng
· ⭐ KÊNH SSL CAO CẤP
_______________________________________________
💧 Công cụ Khối lượng & Thanh khoản
· 🔥 Bản đồ Nhiệt POC Khối lượng
· 🔍 Khoảng cách Giá Trị Công bằng Động lượng
· 🕒 Phiên Khoảng cách Giá Trị Công bằng
_______________________________________________
⚡ Chỉ báo Động lượng & RSI
· 🔎 Theo dõi Định hướng Nến Đa cấp
Tracker
_______________________________________________
🔮 Công cụ Dự đoán & Chiếu dự
· 📐 Dự đoán Dựa trên Linreg& ATR
· 📏 Hồi quy Tuyến tính Fibonacci Đa khung thời gian
· 📈 Máy chiếu Dòng chảy Thị trường Dựa trên Khối lượng
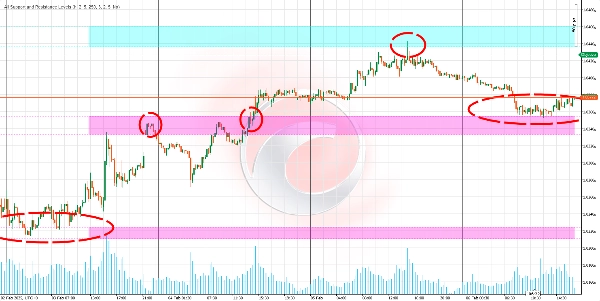
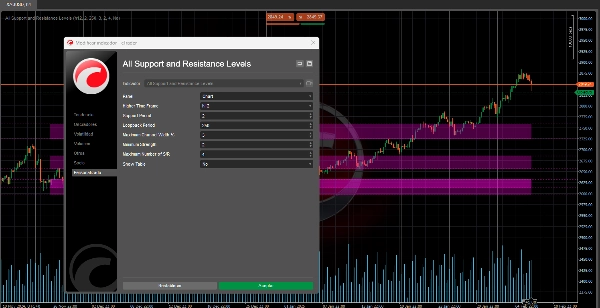
Thuật toán này là một chỉ báo hỗ trợ và kháng cự nâng cao được thiết kế để giúp bạn xác định các mức quan trọng trên thị trường.
Ưu điểm chính của nó là cho phép bạn xem các mức hỗ trợ và kháng cự từ bất kỳ khung thời gian nào (như hàng ngày, hàng tuần hoặc hàng tháng) trực tiếp trên biểu đồ bạn đang phân tích, ngay cả khi đó là khung thời gian khác (ví dụ: 15 phút hoặc 1 giờ). 📊⏰
Nó dùng để làm gì? 🎯
Xác định các vùng thị trường quan trọng:
- Phát hiện các mức mà giá có thể dừng lại, bật lên hoặc phá vỡ mạnh mẽ. 🛑↗️↘️
- Giúp bạn đưa ra quyết định thông minh hơn về điểm vào, điểm ra và điểm dừng lỗ. 💡📈📉
Phân tích nhiều khung thời gian mà không cần chuyển đổi biểu đồ:
- Xem các mức quan trọng từ các khung thời gian cao hơn (như hàng ngày hoặc hàng tuần) trong khi giao dịch trên các khung thời gian thấp hơn (như 15 phút hoặc 1 giờ). 🕒📅
- Mang đến cho bạn cái nhìn tổng quan rộng hơn về thị trường mà không cần liên tục chuyển đổi biểu đồ. 🌍🔍
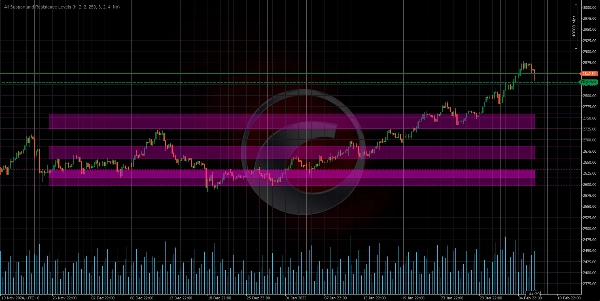
Ưu tiên các mức quan trọng:
- Chỉ báo xếp hạng các mức hỗ trợ và kháng cự dựa trên "độ mạnh" của chúng, nghĩa là tần suất giá đã tương tác với chúng trong quá khứ. 💪📊
- Điều này giúp bạn tập trung vào các mức có liên quan và đáng tin cậy nhất. 🎯✅
Logic hoạt động như thế nào? 🧠⚙️
Thu thập dữ liệu:
- Chỉ báo lấy giá cao và thấp từ một khung thời gian cụ thể (hàng ngày, hàng tuần, v.v.). 📈📉
- Dữ liệu này được sử dụng để tìm kiếm các mẫu quan trọng trong hành vi giá. 🔍📊
Phát hiện các điểm chính (điểm xoay):
- Xác định các đỉnh và đáy cục bộ — những điểm mà giá đạt đến đỉnh hoặc đáy so với các mức giá lân cận. ⛰️🌄
- Những điểm này là ứng viên để trở thành các mức hỗ trợ hoặc kháng cự. 🎯📌
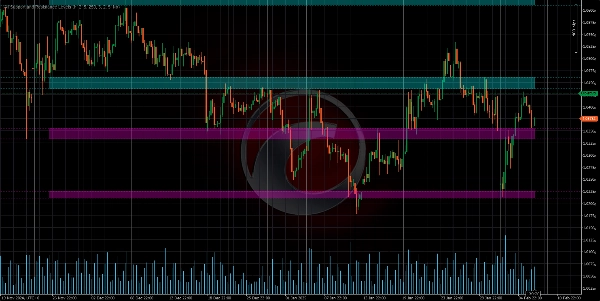
Nhóm các mức:
- Các mức gần nhau được nhóm lại để tạo thành các vùng hỗ trợ hoặc kháng cự, thay vì các đường chính xác. 🟦🟧
- Điều này phản ánh ý tưởng rằng hỗ trợ và kháng cự là các khu vực, không phải điểm chính xác. 📏🎯
Tính toán độ mạnh của mức:
"Độ mạnh" của một mức được xác định bởi hai yếu tố:
- Tần suất chạm: Bao nhiêu lần giá đã chạm hoặc gần mức đó trong quá khứ. 🔄📊
- Sự tập trung của các điểm chính: Có bao nhiêu đỉnh hoặc đáy gần mức đó. 🔗📈
Các mức có độ mạnh lớn hơn được coi là quan trọng hơn. 💪🎯
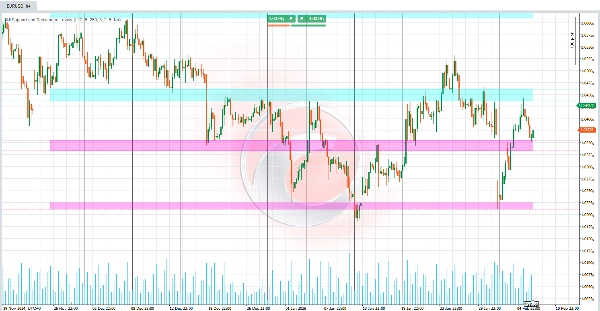
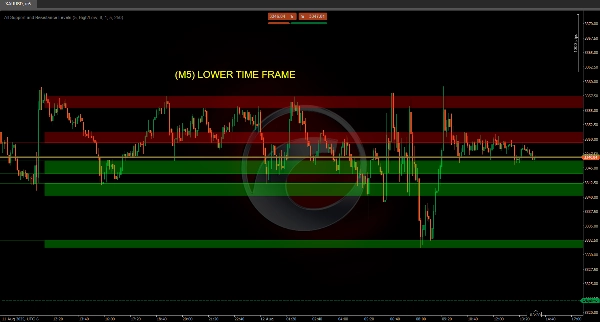
Hiển thị trên biểu đồ:
- Các mức được vẽ dưới dạng các đường ngang hoặc vùng màu trên biểu đồ. 🎨📊
- Màu sắc của mỗi mức phụ thuộc vào vị trí giá hiện tại:
-
- Kháng cự: Nếu giá nằm dưới mức đó. 🔴
- Hỗ trợ: Nếu giá nằm trên mức đó. 🟢
- Trong phạm vi: Nếu giá nằm trong phạm vi của mức đó. 🟡
Làm thế nào để bạn xem các khung thời gian khác nhau trên biểu đồ của mình? 🕒📊
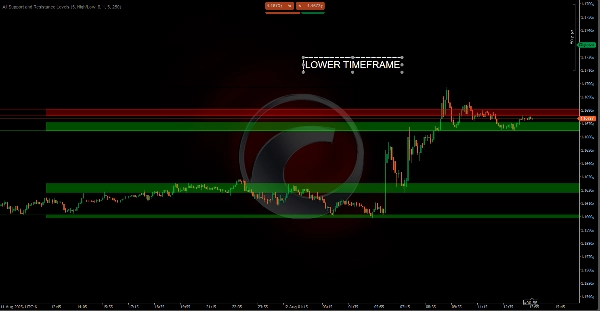
Hỗ trợ và kháng cự từ các khung thời gian cao hơn trên biểu đồ khung thời gian thấp hơn:
- Ví dụ, nếu bạn đang phân tích biểu đồ 15 phút, chỉ báo có thể hiển thị các mức quan trọng từ khung thời gian hàng ngày hoặc hàng tuần. 🕒📅
- Điều này cho phép bạn nhìn thấy các mức quan trọng trong bối cảnh cao hơn mà không cần rời khỏi biểu đồ hiện tại. 🌍🔍
Hỗ trợ và kháng cự từ các khung thời gian thấp hơn trên biểu đồ khung thời gian cao hơn:
- Mặc dù ít phổ biến hơn, bạn cũng có thể xem các mức từ các khung thời gian nhỏ hơn (như 1 phút hoặc 5 phút) trên các biểu đồ khung thời gian cao hơn (như hàng ngày hoặc hàng tuần). 🕒📅
- Điều này có thể hữu ích cho phân tích chi tiết hơn trong bối cảnh rộng hơn. 🔍📊
Tóm tắt
The indicator analyzes price data by collecting highs and lows from specified timeframes, identifying local pivot points where price peaks or valleys occur. These points are grouped into zones representing support or resistance areas rather than precise lines. Each level is assigned a strength score based on the frequency of price touches and the clustering of key points, helping users prioritize the most significant and reliable levels.
Visualized on the chart as horizontal lines or colored zones, the indicator uses color coding to indicate the price's position relative to each level: red for resistance (price below level), green for support (price above level), and yellow when price is within the level’s range. This tool assists traders in making informed decisions on entries, exits, and stop-loss placements by highlighting where price may stop, bounce, or break with strength.
Đánh giá của khách hàng
5 | 50 % | |
4 | 0 % | |
3 | 0 % | |
2 | 0 % | |
1 | 50 % |


