
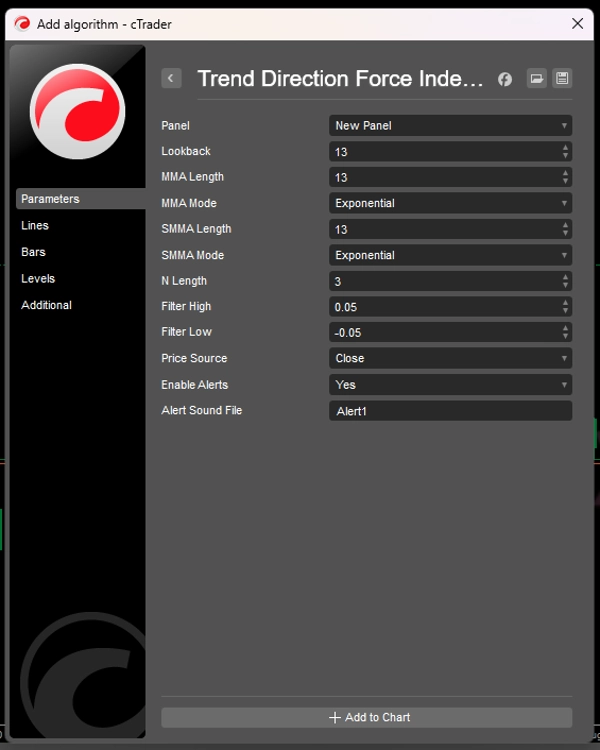
Trend Direction Force Index - TDFI (Alerts)
지표
2 구매
버전 1.0, Aug 2025
Windows, Mac
4.7
리뷰: 4
설명
트렌드 방향 힘 지수(Trend Direction Force Index, TDFI)는강력한 모멘텀 기반 지표로, 트레이더가 강한 추세 움직임과 잠재적 반전을 정확하게 식별할 수 있도록 설계되었습니다. 두 이동 평균과 그 변화율 간의 관계를 분석하여 TDFI는 시장 노이즈를 걸러내고 높은 확률의 거래 기회를 강조합니다.
주요 특징:
✅ 명확한 추세 식별 – 사용자 정의 임계값에 따라 강세(녹색)와 약세(빨간색) 모멘텀을 시각적으로 구분합니다.
✅ 적응형 평활화 – 최적의 반응성을 위해 여러 이동 평균 유형(EMA, WMA, Hull, TEMA 등)을 사용합니다.
✅ 노이즈 감소 – 동적 정규화를 통해 중요한 가격 움직임만 신호를 발생시킵니다.
✅ 사용자 정의 가능한 알림 – 추세가 강화되거나 반전될 때 실시간 알림을 받습니다.
✅ 모든 시간대에서 작동 – 스캘핑, 데이 트레이딩, 스윙 트레이딩에 효과적입니다.
TDFI 작동 원리
TDFI는 두 개의 특별히 조정된 이동 평균 간의 발산과 모멘텀을 분석하여 추세 강도를 측정합니다:
- MMA (주 이동 평균) – 단기 가격 모멘텀을 추적합니다
- SMMA (평활 이동 평균) – 기본 추세를 식별합니다
그 후 지표는 다음을 계산합니다:
🔹 발산 힘 – MMA 간의 거리(추세 강도)
🔹 모멘텀 가속도 – 추세가 얼마나 빠르게 움직이는지
🔹 정규화된 출력 – 극단적인 값을 피하기 위해 신호를 조정합니다
이 힘들이 결합될 때:
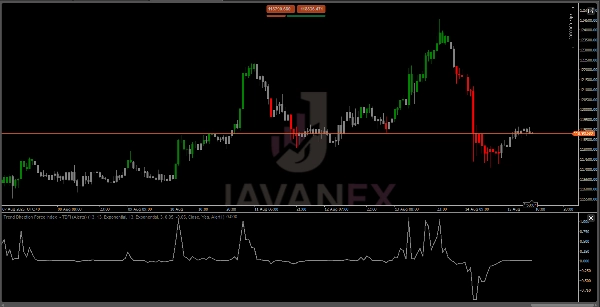
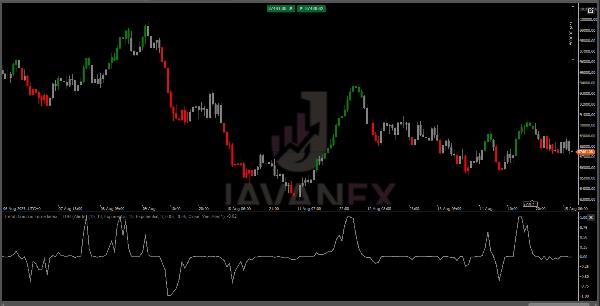
- TDFI > 상한 임계값 (녹색) = 강한 강세 모멘텀
- TDFI < 하한 임계값 (빨간색) = 강한 약세 모멘텀
- 임계값 사이 (회색) = 중립/통합 상태
요약
AI 요약
The Trend Direction Force Index (TDFI) is a momentum-based trading indicator designed to identify strong trend movements and potential reversals by analyzing the relationship and rate of change between two moving averages: a Main Moving Average (MMA) for short-term momentum and a Smoothed Moving Average (SMMA) for the underlying trend. TDFI calculates divergence force (distance between MMAs), momentum acceleration (trend speed), and normalizes these values to filter out market noise. The indicator visually distinguishes bullish momentum (green), bearish momentum (red), and neutral/consolidation phases (gray) based on customizable thresholds. It supports adaptive smoothing using various moving average types such as EMA, WMA, Hull, and TEMA for responsiveness. TDFI includes customizable real-time alerts for trend strength changes and reversals and is applicable across all timeframes, making it suitable for scalping, day trading, and swing trading.
지표 프로필
고객 리뷰
4.7
리뷰: 4
5 | 75 % | |
4 | 25 % | |
3 | 0 % | |
2 | 0 % | |
1 | 0 % |
고객 리뷰
October 10, 2025
Clean and powerful! ⚡ TDFI nails trend strength and timing — great for spotting impulses and avoiding fakeouts. Simple, smooth, and rock solid!
August 30, 2025
the useful bit is direction is easier to respect, and the trade still needs a calm entry.
August 24, 2025
August 21, 2025
상담
자주 묻는 질문(FAQ)
트레이딩 봇, 지표, 플러그인 등 cTrader Store에서 제공되는 상품은 제3자 개발자에 의해 제공되며, 이는 단순히 정보 및 기술적 접근을 목적으로 제공된 것입니다. cTrader Store는 중개인이 아니며, 투자 조언, 개인별 추천 또는 향후 성과에 대한 어떠한 보장도 제공하지 않습니다.


가격
가입일 14/07/2025
60
판매