
설명
HTF POWER 3
ICT Power of 3 · M1 Precision · H4 Intelligence
1분 차트에서 축적 → 조작 → 분배 자동 감지
기능
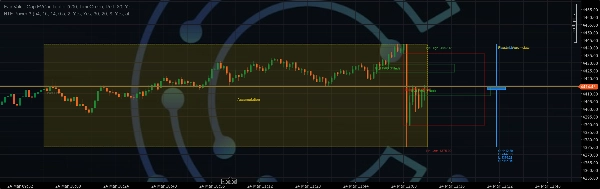
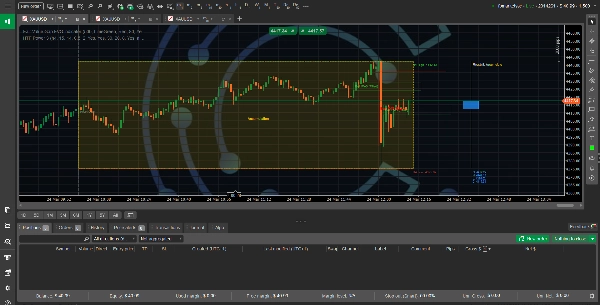
HTF Power 3는 H4 캔들을 상위 시간 프레임 앵커로 사용하여 ICT Power of 3 (AMD) 프레임워크 전체를 M1 차트에 매핑합니다. 각 단계는 자동으로 감지됩니다 — ATR을 통해 축적 구역이 잠기고, 스윕이 발생하는 순간 조작이 표시되며, CISD에서 분배가 확인됩니다. 세 가지 세션 구역 모두 색상 코드가 지정된 강조 사각형으로 H4 고가에서 저가까지 전체 범위를 표시하여 현재 어떤 단계에 있는지 항상 정확히 알 수 있습니다.
3단계 감지
1단계 축적
2단계 조작
3단계 분배
H4 오픈 후 M1 바가 밀집되어 통합됩니다. ATR 슬라이딩 윈도우를 통해 골드 존이 자동 감지됩니다.
축적 경계를 스윕하며 H4 세션 극한과 SL 레벨을 설정합니다.
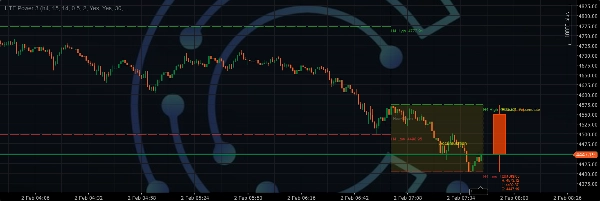
가격 CISD 바가 진입, SL 및 TP 라인을 트리거합니다. 그린 존은 H4 캔들 클로즈까지 확장됩니다.
주요 특징
▸ ATR을 사용하여 H4 축적 구역 자동 감지 — 슬라이딩 윈도우가 가장 좁은 M1 범위를 찾음
▸ 조작 오렌지 존은 스윕 바에서 즉시 표시 — CISD를 기다릴 필요 없음
▸ 분배 그린 존은 CISD 바에서 H4 캔들 클로즈까지 확장
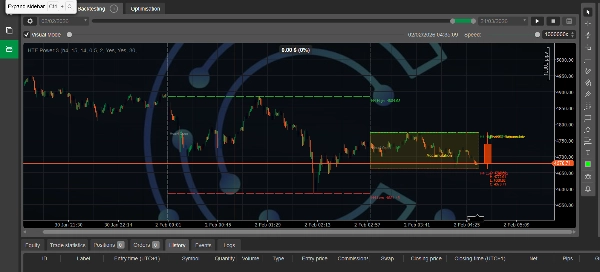
▸ H4 고가 및 저가는 추세선으로 제한 — 차트 전체에 무한한 수평선 혼란 없음
▸ 가격 오른쪽에 실시간 H4 캔들 복제본 표시, OHLC 라벨과 함께 바 단위로 업데이트
▸ 마지막 2개의 H4 캔들만 표시 — 오래된 도형은 자동 제거되어 깔끔한 차트 유지
▸ CISD에서 진입 / SL / TP 라인 자동 계산, 구성 가능한 R:R 비율 및 핍 요약 포함
▸ 강세 및 약세 PO3 독립적으로 토글 가능
▸ CISD 확인 시 H4 캔들마다 한 번씩 사운드 + 화면 알림 발생
거래 방법
1 새로운 H4 캔들이 열릴 때까지 기다리세요 — 점선 수직선이 정확한 오픈 시간을 표시합니다.
2 오픈 후 첫 M1 바에서 골드 축적 구역이 형성되는 것을 관찰하세요.
3 가격이 범위를 스윕합니다 — 오렌지 조작 구역이 스윕 바에서 즉시 켜집니다.
4 CISD 발동: M1이 이전 M1 고가 위에서 마감(강세) 또는 이전 M1 저가 아래에서 마감(약세)합니다.
5 CISD 마감 시 진입하세요. SL = H4 조작 극한. TP = 설정한 R 배수.
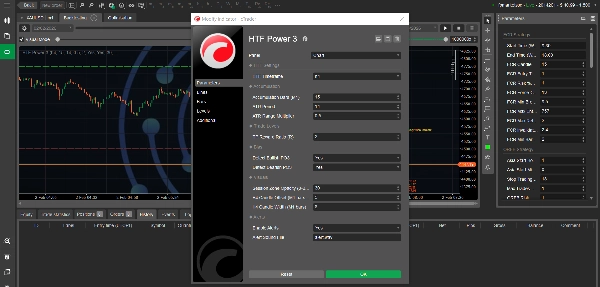
매개변수 참조
매개변수 기본값
설명
HTF 시간 프레임 H4
PO3 감지를 위한 상위 시간 프레임 캔들 앵커
축적 바 (M1) 15
통합 구역을 스캔하는 M1 바 수
ATR 기간 14
범위 변동성 필터링을 위한 ATR 조회 기간
ATR 범위 배수 0.5
ATR 배수로서 최대 범위 — 낮을수록 더 좁은 구역 필요
TP 보상 비율 (R) 2.0
SL 거리의 배수로 표현된 이익 실현
강세 / 약세 감지 둘 다
강세 및/또는 약세 PO3 감지를 독립적으로 토글
세션 구역 불투명도 30
구역 박스 투명도 — 5 (미묘함)에서 120 (강함)까지
H4 캔들 오프셋 20
H4 캔들 복제본을 위한 가격 오른쪽의 M1 바 수
H4 캔들 너비 8
M1 바 단위의 캔들 복제 너비
알림 활성화 예
CISD 시 H4 캔들마다 한 번씩 사운드 + 화면 팝업 발생
시각적 범례
골드 존
축적 — 가격 범위 형성, H4 오픈 후 주문 흐름 구축
오렌지 존
조작 — 유동성 스윕이 활발히 진행 중
그린 존
분배 — 확인된 움직임, TP까지 추세를 타세요
녹색 점선
H4 세션 고가 — 현재 H4 캔들 내에서만 제한된 선
빨간 점선
H4 세션 저가 — 현재 H4 캔들 내에서만 제한된 선
▲ 파란색 텍스트
CISD 롱 확인 — 이전 M1 고가 위에서 진입
▼ 오렌지 텍스트
CISD 숏 확인 — 이전 M1 저가 아래에서 진입
기술 사양
플랫폼: cTrader / cAlgo
차트 시간 프레임: M1 (IsOverlay = true)
HTF 기본값 H4 — 모든 시간 프레임으로 구성 가능
상품 모두 — XAUUSD에 최적화됨
내장 지표: ATR (WilderSmoothing) — 외부 의존성 없음
접근 권한: 필요 없음
표시된 기록: 최근 2개의 H4 캔들 — 오래된 도형 자동 제거
알림: 사운드 파일 + 화면 배너, H4 캔들당 한 번씩
버전: 1.
M1에서 스마트 머니를 거래하는 ICT 트레이더를 위해 제작되었습니다.
전체 H4 Power of 3가 실시간으로, 바 단위로 펼쳐지는 모습을 확인하세요.
요약
고객 리뷰
5 | 50 % | |
4 | 50 % | |
3 | 0 % | |
2 | 0 % | |
1 | 0 % |


!["[Hamster-Coder] Pivot Points MTF" 로고](https://cdn.ctrader.com/image/webp/4c143e5a-309c-40e3-a578-f04d1e133ffa_31159)


