
설명
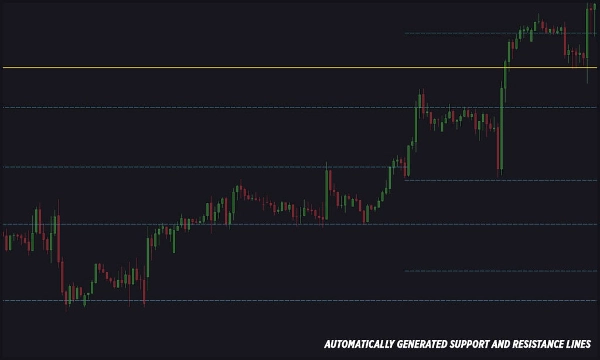
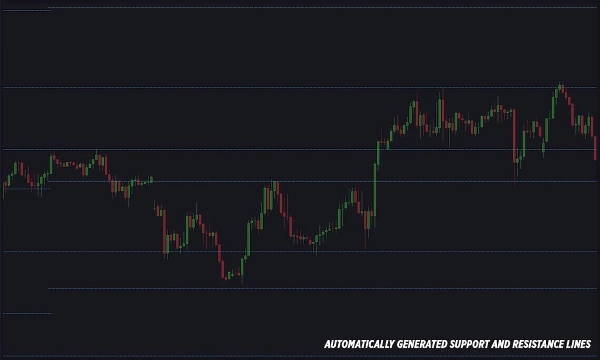
이 cTrader 지표는 차트에 자동으로 지지선과 저항선을 그려 초보자와 전문가 모두 쉽게 사용할 수 있습니다. 이 선들은 주요 피보나치 수준과 가격 스윙(지그재그)을 기반으로 생성됩니다.
특징:
- 지지선과 저항선을 자동으로 감지하고 그립니다.
- 완전한 사용자 정의 가능한 선 스타일, 두께 및 색상.
- 조정 가능한 지지선 및 저항선 수.
- 가격이 지지선 또는 저항선과 상호작용할 때 알림.
- 다양한 알림 옵션: 텔레그램, 이메일, 팝업 및 소리.
- 어떤 피보나치 수준이 선을 생성할지 선택 가능.
- Ask 또는 Bid 가격선에서 알림을 트리거하는 옵션.
- 구성 가능한 알림 조건: 바 마감 알림 또는 즉시 가격 터치 알림.
- 사용자 정의 코멘트가 포함된 맞춤형 알림 메시지.
- 강한 지지선 및 저항선에 대해서만 알림을 활성화하는 옵션.
- 텔레그램을 통해 차트 스크린샷을 캡처하고 전송하는 기능(차트가 보여야 함).
- 간단한 이메일 알림 설정.
- 차트의 작은 버튼을 통해 사용자 가이드에 빠르게 접근 가능.
요약
AI 요약
VegaXLR - Auto Support and Resistance is a cTrader indicator that automatically identifies and draws support and resistance lines on trading charts. It uses key Fibonacci levels combined with price swing analysis (zigzags) to generate these lines, aiding traders in recognizing critical price levels. The indicator offers full customization of line styles, thickness, and colors, and allows adjustment of the number of support and resistance lines displayed.
It features real-time alerts triggered when price interacts with these levels, with configurable conditions such as bar-close or instant price-touch alerts. Alert notifications can be sent via multiple channels including Telegram, Email, pop-ups, and sounds. Users can specify which Fibonacci levels to use for line generation and choose whether alerts trigger from Ask or Bid price lines. Additional options include enabling alerts only for strong levels, customizing alert messages, and capturing chart screenshots to send via Telegram.
A user guide is accessible directly from the chart for ease of use. This tool supports Forex markets and is designed to assist both beginners and professionals in technical analysis by automating the detection of key support and resistance zones.
지표 프로필
고객 리뷰
4.3
리뷰: 3
5 | 67 % | |
4 | 0 % | |
3 | 33 % | |
2 | 0 % | |
1 | 0 % |
고객 리뷰
March 2, 2025
Focused trade layer if the trader wants it keeps attention on levels that actually matter. It works best as support, not a final decision maker. The cleanest use is 3 to 5 levels per chart, with 0.5 pullbacks checked before entry. not every zone holds, even if it looks clean.
March 1, 2025
March 1, 2025
Balanced demo helper for traders who build plans around market levels. It gives value around key price zones, but not every zone holds, even if it looks clean. I would wait for 2 reactions and avoid trades where the target is less than 1.5R. Levels are useful when they reduce noise, not when they crowd the chart.
상담
자주 묻는 질문(FAQ)
Forex
트레이딩 봇, 지표, 플러그인 등 cTrader Store에서 제공되는 상품은 제3자 개발자에 의해 제공되며, 이는 단순히 정보 및 기술적 접근을 목적으로 제공된 것입니다. cTrader Store는 중개인이 아니며, 투자 조언, 개인별 추천 또는 향후 성과에 대한 어떠한 보장도 제공하지 않습니다.
이 작성자의 상품 더 보기


!["[Hamster-Coder] Moving Average MTF" 로고](https://cdn.ctrader.com/image/webp/b11b98b1-194d-4b8e-b00e-d611826ad159_31226)


가격
215
판매
680
무료 설치