
FVG & Imbalance Detector
อินดิเคเตอร์
2 การซื้อ
เวอร์ชัน 1.0, Jan 2026
Windows, Mac
4.0
รีวิว: 2
คำอธิบาย
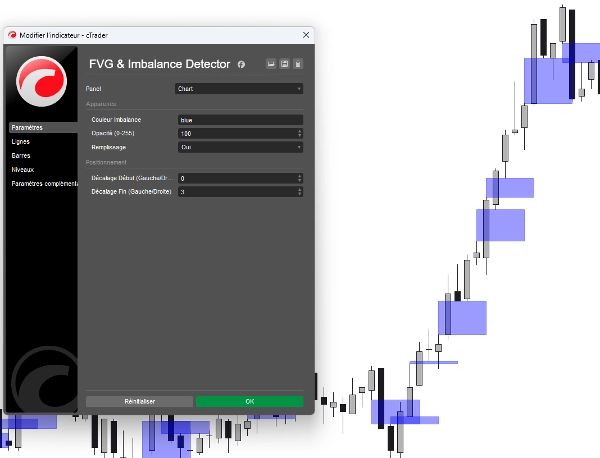
ในโลกของ Smart Money Concepts (SMC) และ ICT, ความไม่สมดุลของราคาเป็น "ลายนิ้วมือ" ของผู้เล่นสถาบันรายใหญ่ เมื่อตลาดเคลื่อนไหวเร็วเกินไป จะทิ้ง Fair Value Gap (FVG)—โซนที่ไม่มีประสิทธิภาพซึ่งราคามักจะกลับมา "เติมเต็ม" หรือทดสอบซ้ำเสมอ
เครื่องมือ FVG & Imbalance Detector สำหรับ cTrader เป็นเครื่องมือประสิทธิภาพสูงที่ออกแบบมาเพื่อตรวจจับความไม่มีประสิทธิภาพเหล่านี้โดยอัตโนมัติ ไม่ต้องวาดด้วยมืออีกต่อไป—รับโซนที่ชัดเจนและใช้งานได้โดยตรงบนแผนภูมิของคุณ
ทำไมตัวบ่งชี้นี้จึงจำเป็นต้องมี:
- 🚀 ระบุการเคลื่อนไหวของสถาบัน: ดูว่าธนาคารใหญ่และกองทุนเฮดจ์ได้เข้าสู่ตลาดด้วยปริมาณมหาศาลที่ไหนบ้าง
- 🎯 โซนที่มีความน่าจะเป็นสูง: ใช้ความไม่สมดุลที่ระบุเป็นเป้าหมายแม่เหล็กสำหรับการทำกำไรหรือเป็น "โซนทองคำ" สำหรับการเข้าที่แม่นยำ
- 📈 การแสดงผลที่ชัดเจน: การซ้อนสี่เหลี่ยมคุณภาพสูงที่ทำให้การวิเคราะห์แนวโน้มเป็นเรื่องง่าย
- 🔧 ยืดหยุ่นเต็มที่: แตกต่างจากตัวบ่งชี้พื้นฐาน รุ่นนี้ช่วยให้คุณขยายโซนไปข้างหน้าหรือปรับจุดเริ่มต้นให้ตรงกับกลยุทธ์เฉพาะของคุณได้
คุณสมบัติเฉพาะ:
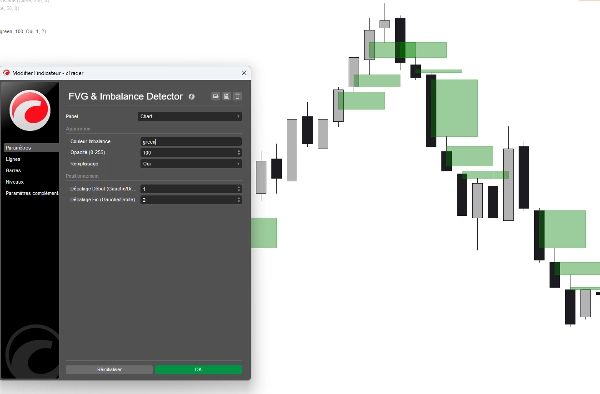
- ตรรกะการตรวจจับอัจฉริยะ: อัลกอริทึมขั้นสูงระบุความไม่มีประสิทธิภาพทั้งด้านบน (ขาลง) และด้านล่าง (ขาขึ้น) ด้วยความแม่นยำระดับพิกเซล
- การเลื่อนตำแหน่งสองทิศทาง: พารามิเตอร์เลื่อน "เริ่ม" และ "สิ้นสุด" เฉพาะช่วยให้คุณฉายโซนไปข้างหน้าหรือถอยหลังเพื่อดูว่าช่องว่างในอดีตสอดคล้องกับการเคลื่อนไหวราคาปัจจุบันอย่างไร
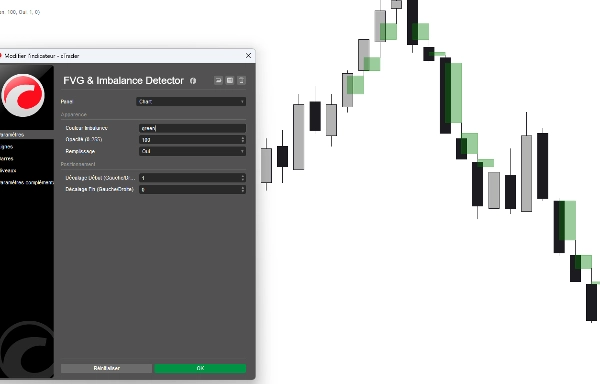
- อินเทอร์เฟซสีมืออาชีพ: เลือกสไตล์ที่คุณชอบผ่านเมนูแบบเลื่อนลงที่สะอาดตา (เหลือง, น้ำเงิน, แดง ฯลฯ)—ไม่ต้องพิมพ์รหัสสีอีกต่อไป!
- ควบคุมความทึบ: ปรับความโปร่งใสเพื่อไม่ให้โซนรกสายตาของคุณขณะดูการเคลื่อนไหวของราคา
- ประสิทธิภาพที่ปรับปรุงแล้ว: โค้ดน้ำหนักเบาที่จะไม่ทำให้แพลตฟอร์ม cTrader ของคุณช้าลง แม้บนหลายแผนภูมิ
วิธีใช้งาน:
- ระบุช่องว่าง: ตัวบ่งชี้จะวาดกล่องที่เกิดความไม่สมดุลระหว่างจุดสูงสุดของแท่งเทียนแรกและจุดต่ำสุดของแท่งเทียนที่สาม
- รอการทดสอบซ้ำ: สังเกตราคาที่กลับมาที่กล่องเหล่านี้
- ดำเนินการ: มองหารูปแบบการปฏิเสธภายในโซน FVG สำหรับการเข้าที่มีความเสี่ยงต่ำและผลตอบแทนสูง
สรุป
สรุปโดย AI
The FVG & Imbalance Detector is an indicator for the cTrader platform designed to identify Fair Value Gaps (FVG) and price imbalances, key concepts in Smart Money Concepts (SMC) and Institutional Cycle Trading (ICT). These gaps represent zones of market inefficiency created by rapid price moves, often reflecting institutional activity. The indicator automatically detects and highlights these zones on the chart with clear rectangular overlays, eliminating the need for manual drawing.
Key features include detection of both bullish (bottom) and bearish (top) imbalances with high precision, customizable zone extensions via start and end offset parameters, and adjustable opacity and color settings for clear visualization. The tool is optimized for performance to avoid slowing down the platform, even when applied to multiple charts.
Traders can use the indicator to spot where large institutional players have entered the market, identify high-probability zones for entries or take-profits, and monitor price retests of these inefficiency zones for potential trade execution. The indicator supports analysis across various markets including Forex, Indices, Commodities, and Crypto.
โปรไฟล์อินดิเคเตอร์
รีวิวจากลูกค้า
4.0
รีวิว: 2
5 | 0 % | |
4 | 100 % | |
3 | 0 % | |
2 | 0 % | |
1 | 0 % |
รีวิวจากลูกค้า
January 18, 2026
tested small first and that felt like the right move, and account protection still comes first.
January 14, 2026
การสนทนา
คำถามที่พบบ่อย
Forex
Indices
Commodities
Crypto
AI
ผลิตภัณฑ์ที่มีให้บริการผ่าน cTrader Store รวมถึงบอทการเทรด อินดิเคเตอร์ และปลั๊กอิน มีให้บริการโดยนักพัฒนาบุคคลที่สามและมีไว้เพื่อวัตถุประสงค์ในการเข้าถึงข้อมูลและทางเทคนิคเท่านั้น cTrader Store ไม่ใช่โบรกเกอร์และไม่ได้ให้คำแนะนำการลงทุน คำแนะนำส่วนบุคคล หรือการรับประกันผลการดำเนินงานในอนาคต
เพิ่มเติมจากผู้เขียนคนนี้


ราคา
ตั้งแต่ 27/10/2025
10
การขาย