
HA
อินดิเคเตอร์
2 การซื้อ
เวอร์ชัน 1.0, Jan 2026
Windows, Mac
4.0
รีวิว: 1
คำอธิบาย
The Pro Heikin Ashi Visual Overlay เป็นเครื่องมือที่สมบูรณ์แบบสำหรับเทรดเดอร์ที่ต้องการประโยชน์จากการปรับแนวโน้มของแท่งเทียน Heikin Ashi ในขณะที่ยังคงใช้แผนภูมิแท่งเทียนหรือแท่งบาร์มาตรฐานของตนอยู่
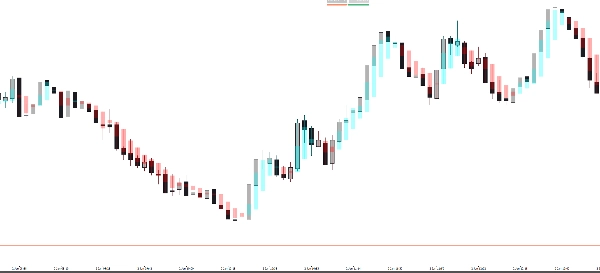
Traditional Heikin Ashi charts require you to switch the entire chart type, making it hard to see exact price action. This indicator solves that by drawing Heikin Ashi candles as a semi-transparent overlay, allowing you to spot trend reversals and market momentum instantly without losing sight of the real price.
ทำไมต้องใช้ Overlay นี้?
- 💎 ลดเสียงรบกวน: Heikin Ashi กรองเสียงรบกวนในตลาด ทำให้ง่ายต่อการอยู่ในเทรดที่ชนะ
- 🕯️ ดูแผนภูมิคู่: เก็บแท่งเทียนมาตรฐานของคุณสำหรับการเคลื่อนไหวราคา/รูปแบบในขณะที่ใช้ overlay HA สำหรับทิศทางแนวโน้ม
- 🎨 ปรับแต่งได้เต็มที่: ปรับความทึบและสีให้ตรงกับพื้นที่ทำงานของคุณ (โหมดมืดหรือสว่าง)
- 🚀 ระบุแนวโน้มทันที: โซนสีน้ำเงิน (กระทิง) และสีแดง (หมี) ช่วยให้คุณหลีกเลี่ยงการเทรดสวนกับโมเมนตัม
คุณสมบัติหลัก:
- ความโปร่งใสอัจฉริยะ: ตั้งค่าความทึบเพื่อให้ overlay ไม่บดบังการเคลื่อนไหวราคาหลักของคุณ
- การจัดตำแหน่งที่สมบูรณ์แบบ: คำนวณแบบเรียลไทม์ให้ตรงกับค่าของ Heikin Ashi ในกรอบเวลาปัจจุบัน
- การออกแบบระดับมืออาชีพ: ภาพที่สะอาดตาไม่ทำให้แผนภูมิของคุณรก
- ใช้งานได้ทั่วโลก: ใช้งานได้กับทุกกรอบเวลา (M1 ถึงรายเดือน) และทุกสินทรัพย์ (Forex, หุ้น, Crypto, ดัชนี)
วิธีใช้:
- นำตัวบ่งชี้ไปใช้กับแผนภูมิของคุณ
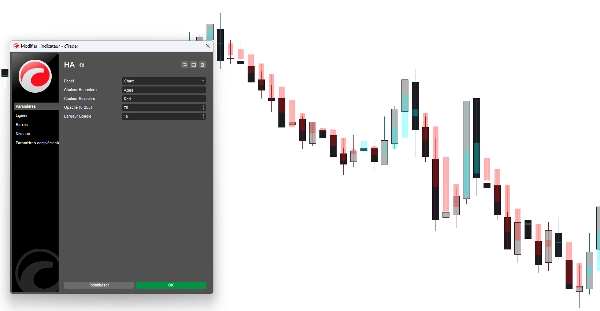
- ปรับ ความทึบ และ ความกว้างของแท่งเทียน ในการตั้งค่าตามที่คุณต้องการ
- ใช้แท่งเทียน HA เพื่อยืนยันความแข็งแกร่งของแนวโน้ม:
-
- ไส้เทียนยาวในทิศทางแนวโน้ม = โมเมนตัมแข็งแกร่ง
- แท่งเทียนขนาดเล็กมีไส้เทียนทั้งสองด้าน = มีโอกาสกลับตัว
พารามิเตอร์:
- สีสำหรับกระทิง: สีที่กำหนดเองสำหรับแท่งเทียน HA ขาขึ้น
- สีสำหรับหมี: สีที่กำหนดเองสำหรับแท่งเทียน HA ขาลง
- ความทึบ (0-255): ควบคุมว่าแท่งเทียนจะดูเหมือนผีหรือทึบแค่ไหน
- ความกว้างแท่งเทียน: ปรับความหนาของแท่งเทียน HA ให้เหมาะกับระดับการซูมของคุณ
สรุป
สรุปโดย AI
The Pro Heikin Ashi Visual Overlay is an indicator designed to enhance trend analysis by overlaying Heikin Ashi candles on standard candlestick or bar charts. Unlike traditional Heikin Ashi charts that replace the entire chart type, this tool provides a semi-transparent overlay, allowing traders to observe smoothed trend signals while retaining visibility of actual price action.
Key features include noise reduction to filter market fluctuations, customizable opacity and colors for integration with different chart backgrounds, and real-time alignment with the current timeframe’s Heikin Ashi calculations. The overlay uses blue and red zones to indicate bullish and bearish trends, aiding in immediate trend identification. It supports all timeframes from one minute to monthly and is compatible with various asset classes including Forex, stocks, cryptocurrencies, commodities, and indices.
Users can adjust candle width and opacity to suit their chart zoom level and visual preferences. The indicator facilitates dual-chart viewing, enabling simultaneous analysis of precise price patterns and smoothed trend momentum. It is designed with clean visuals to avoid chart clutter and supports professional trading environments.
โปรไฟล์อินดิเคเตอร์
รีวิวจากลูกค้า
4.0
รีวิว: 1
5 | 0 % | |
4 | 100 % | |
3 | 0 % | |
2 | 0 % | |
1 | 0 % |
การสนทนา
คำถามที่พบบ่อย
Forex
Signal
Indices
Commodities
Crypto
Stocks
ผลิตภัณฑ์ที่มีให้บริการผ่าน cTrader Store รวมถึงบอทการเทรด อินดิเคเตอร์ และปลั๊กอิน มีให้บริการโดยนักพัฒนาบุคคลที่สามและมีไว้เพื่อวัตถุประสงค์ในการเข้าถึงข้อมูลและทางเทคนิคเท่านั้น cTrader Store ไม่ใช่โบรกเกอร์และไม่ได้ให้คำแนะนำการลงทุน คำแนะนำส่วนบุคคล หรือการรับประกันผลการดำเนินงานในอนาคต
เพิ่มเติมจากผู้เขียนคนนี้


ราคา
ตั้งแต่ 27/10/2025
10
การขาย