
Volume Meter
อินดิเคเตอร์
2 การซื้อ
เวอร์ชัน 1.0, Sep 2025
Windows, Mac
5.0
รีวิว: 1
คำอธิบาย
📘 ตัวบ่งชี้นี้ทำอะไร
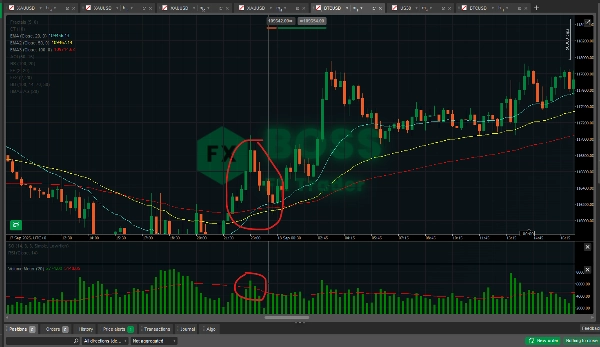
- มันแสดง ปริมาณทิก (จำนวนการเปลี่ยนแปลงราคาต่อแท่ง) ในรูปแบบฮิสโตแกรม
- ในตลาด Forex โบรกเกอร์มักจะไม่ให้ ปริมาณการซื้อขายจริง ดังนั้นจึงใช้ปริมาณทิกแทน
- ในหุ้น/CFDs/ฟิวเจอร์ส คุณอาจได้รับปริมาณจริง
- มันซ้อนทับ ค่าเฉลี่ยเคลื่อนที่ของปริมาณ (ค่าเริ่มต้น 20 ช่วงเวลา)
- ซึ่งทำหน้าที่เป็น “เส้นฐาน” เพื่อช่วยให้เห็นได้อย่างรวดเร็วว่าปริมาณของแท่งปัจจุบันสูงหรือต่ำผิดปกติหรือไม่
🎯 วิธีใช้เป็นการยืนยัน
ตัวบ่งชี้นี้ ไม่ใช่ตัวสร้างสัญญาณอิสระ แต่เทรดเดอร์ใช้เพื่อยืนยันการตั้งค่าจากกลยุทธ์อื่นๆ:
- การยืนยันการเบรกเอาต์
-
- ถ้าราคาทะลุเหนือแนวต้านหรือต่ำกว่าแนวรับ ให้ตรวจสอบว่าแท่งเบรกเอาต์มี ปริมาณสูงกว่าค่าเฉลี่ยเคลื่อนที่ หรือไม่
- ปริมาณสูงยืนยันว่ามีผู้เข้าร่วมมากขึ้นอยู่เบื้องหลังการเคลื่อนไหว → เบรกเอาต์น่าเชื่อถือมากขึ้น
- เบรกเอาต์ที่มีปริมาณต่ำ = โอกาสเบรกเอาต์ปลอมสูงขึ้น
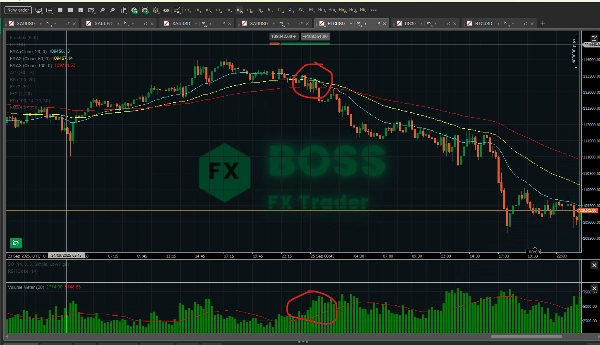
- การต่อเนื่องของแนวโน้มกับความเหนื่อยล้า
-
- ในแนวโน้มที่แข็งแกร่ง แท่งราคาที่ดึงกลับมักมี ปริมาณต่ำกว่า เมื่อเทียบกับแท่งราคาที่เคลื่อนไหวแรง
- ถ้ามีการดึงกลับด้วยปริมาณต่ำและการเคลื่อนไหวถัดไปกลับมาพร้อมปริมาณสูง → ยืนยันการต่อเนื่องของแนวโน้ม
- ถ้าคุณเห็นแนวโน้มยังคงผลักดันแต่ ปริมาณลดลงในแต่ละครั้งที่ผลักดัน → อาจเป็นสัญญาณความเหนื่อยล้า เตรียมพร้อมสำหรับการกลับตัว
- การยืนยันการกลับตัว
-
- แท่งกลับตัวใหญ่ (แท่งพิน, แท่งกลืน, แฟรคทัล) จะมีความแข็งแกร่งมากขึ้นถ้ามี ปริมาณพุ่งสูง รองรับ
- ตัวอย่าง: แท่งพินกระทิงที่แนวรับพร้อมปริมาณสูง = สัญญาณกลับตัวที่แข็งแกร่งกว่าแท่งพินเดียวกันที่มีปริมาณต่ำ
- ตัวกรองสัญญาณปลอม
-
- ถ้าระบบหลักของคุณให้สัญญาณซื้อ/ขาย แต่ปริมาณอ่อนแอ (ต่ำกว่าค่าเฉลี่ย) คุณอาจเลือกที่จะไม่ทำการเทรดนั้น
- ช่วยลดการเทรดเกินและกรองเสียงรบกวน
📊 ประสิทธิภาพ
- ใน Forex: ปริมาณทิกแสดงความสัมพันธ์อย่างมากกับปริมาณการซื้อขายจริง (ความสัมพันธ์ 70–90% ในหลายการศึกษา) ดังนั้นจึงมีประโยชน์แต่ไม่สมบูรณ์แบบ
- ในหุ้น/ฟิวเจอร์ส/CFDs: ปริมาณจริงทำให้ตัวบ่งชี้นี้มีพลังมากขึ้นเพราะคุณกำลังวัดสัญญาหรือหุ้นที่ซื้อขายจริง
- ในฐานะการยืนยัน: ควรใช้ร่วมกับ การเคลื่อนไหวของราคาและตัวบ่งชี้อื่นๆ (เช่น EMA, RSI, แฟรคทัล) การพึ่งพาปริมาณเพียงอย่างเดียวมีความเสี่ยง
- จุดแข็ง: ยืนยันการเบรกเอาต์ กรองการเคลื่อนไหวปลอม และตรวจจับความเหนื่อยล้า
- จุดอ่อน: ไม่สามารถทำนายทิศทางได้ด้วยตัวเอง — เพิ่มความมั่นใจเมื่อคุณมีการตั้งค่าแล้วเท่านั้น
✅ เคล็ดลับปฏิบัติ:
ใช้ตัวบ่งชี้นี้เป็น ตัวกรอง ไม่ใช่ตัวกระตุ้น ตัวอย่างเช่น:
- คุณเห็นการตัดกันของ EMA (สัญญาณซื้อ)
- ตรวจสอบ: ปริมาณสูงกว่าค่าเฉลี่ยเคลื่อนที่หรือไม่? ถ้าใช่ → ทำการเทรด ถ้าไม่ใช่ → รอ
ด้วยวิธีนี้คุณจะเทรดเฉพาะเมื่อโมเมนตัมได้รับการสนับสนุนจากการมีส่วนร่วมของตลาด
สรุป
สรุปโดย AI
Volume Meter is a trading indicator that displays tick volume—the number of price changes per bar—as a histogram. In Forex markets, where real traded volume data is often unavailable, tick volume serves as a proxy, while in stocks, CFDs, and futures, real volume data may be used. The indicator overlays a moving average of volume (default 20-period) to provide a baseline, helping traders identify whether current volume is unusually high or low.
This tool is designed to confirm trading setups rather than generate standalone signals. It assists in validating breakouts by checking if breakout candles have volume above their moving average, indicating stronger market participation. It also helps distinguish trend continuation from exhaustion by comparing volume levels during pullbacks and impulse moves. Additionally, it supports reversal confirmation by highlighting volume spikes on significant reversal candles and filters false signals by advising caution when volume is weak despite buy or sell signals from other systems.
Volume Meter is applicable across various markets including Forex, stocks, indices, commodities, and cryptocurrencies. Its effectiveness is enhanced when combined with price action and other indicators such as EMA or RSI. The indicator aids in improving trade decision confidence by integrating volume analysis as a confirmation and filtering tool.
โปรไฟล์อินดิเคเตอร์
รีวิวจากลูกค้า
5.0
รีวิว: 1
5 | 100 % | |
4 | 0 % | |
3 | 0 % | |
2 | 0 % | |
1 | 0 % |
รีวิวจากลูกค้า
October 1, 2025
the first 10 trades should stay boring, and the checklist becomes easier to follow.
การสนทนา
คำถามที่พบบ่อย
BTCUSD
Forex
Breakout
Indices
EURUSD
Commodities
GBPUSD
NZDUSD
Prop
Supertrend
Crypto
Stocks
XAUUSD
NAS100
USDJPY
ผลิตภัณฑ์ที่มีให้บริการผ่าน cTrader Store รวมถึงบอทการเทรด อินดิเคเตอร์ และปลั๊กอิน มีให้บริการโดยนักพัฒนาบุคคลที่สามและมีไว้เพื่อวัตถุประสงค์ในการเข้าถึงข้อมูลและทางเทคนิคเท่านั้น cTrader Store ไม่ใช่โบรกเกอร์และไม่ได้ให้คำแนะนำการลงทุน คำแนะนำส่วนบุคคล หรือการรับประกันผลการดำเนินงานในอนาคต


ราคา
ตั้งแต่ 29/05/2025
3.04M
ปริมาณการเทรด
45.22K
Pips ที่ได้กำไร
29
การขาย
769
ติดตั้งฟรี