
present
ลงทะเบียนและรับส่วนลด $50 สำหรับการซื้อครั้งแรกของคุณ
Trading product for Fibonacci Automated Level อินดิเคเตอร์ Signal Indices, image 1
Fibonacci Automated Level
อินดิเคเตอร์
1 การซื้อ
เวอร์ชัน 1.0, Apr 2026
Windows, Mac
4.0
รีวิว: 3
Trading product for Fibonacci Automated Level อินดิเคเตอร์ Signal Indices, image 2
Trading product for Fibonacci Automated Level อินดิเคเตอร์ Signal Indices, image 3
Trading product for Fibonacci Automated Level อินดิเคเตอร์ Signal Indices, image 4
Trading product for Fibonacci Automated Level อินดิเคเตอร์ Signal Indices, image 5
Trading product for Fibonacci Automated Level อินดิเคเตอร์ Signal Indices, image 6
ตั้งแต่ 29/05/2025
3.05M
ปริมาณการเทรด
68.12K
Pips ที่ได้กำไร
29
การขาย
880
ติดตั้งฟรี

คำอธิบาย

📊 ตัวบ่งชี้ระดับอัตโนมัติฟีโบนัชชี (BOSSFXTRADER v1.0)

🔍 คำอธิบาย

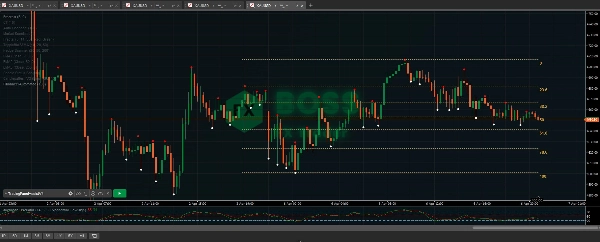
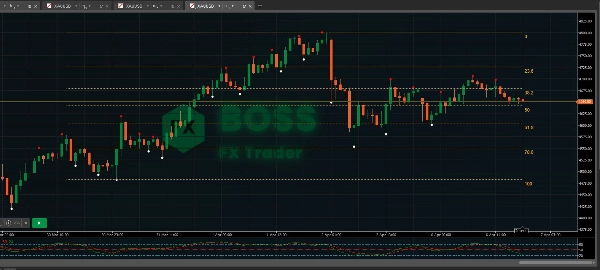
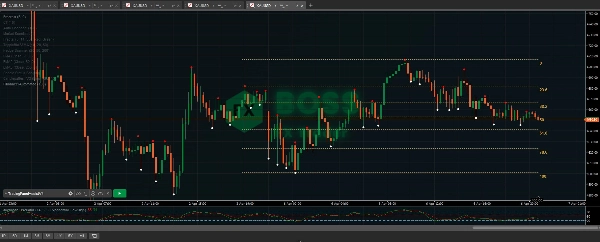
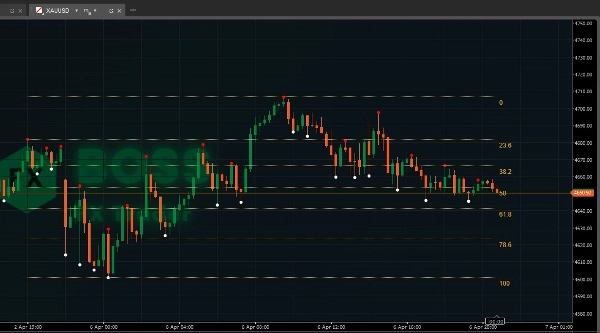
ตัว บ่งชี้ระดับอัตโนมัติฟีโบนัชชี เป็นเครื่องมือการเทรดอัจฉริยะที่ตรวจจับ สวิงตลาดล่าสุด (สูง & ต่ำ) ภายในช่วงเวลาที่กำหนดและวางระดับ ฟีโบนัชชีรีเทรซเมนต์สำคัญ ลงบนกราฟของคุณโดยตรง

แตกต่างจากการวาดฟีโบนัชชีด้วยตนเอง ตัวบ่งชี้นี้:

  • ขจัดความลำเอียง
  • อัปเดตแบบไดนามิกตามโครงสร้างตลาด
  • ช่วยเทรดเดอร์ระบุ โซนเข้าซื้อ ขาย และกลับตัวที่มีความน่าจะเป็นสูง

มันทำงานได้กับ ตลาดใดก็ได้ (ฟอเร็กซ์ ทองคำ คริปโต ดัชนี) และทุกกรอบเวลา


⚙️ วิธีการทำงาน

  • สแกนแท่งเทียนล่าสุดจำนวน X แท่ง (Lookback Bars)
  • ตรวจจับ:
    • สูงสุด
    • ต่ำสุด
  • กำหนดทิศทางแนวโน้ม:
    • 📈 แนวโน้มขาขึ้น → วาดฟีโบนัชชีจากต่ำ → สูง
    • 📉 แนวโน้มขาลง → วาดฟีโบนัชชีจากสูง → ต่ำ
  • วางระดับเหล่านี้โดยอัตโนมัติ:
    • 0.0
    • 23.6%
    • 38.2%
    • 50.0%
    • 61.8%
    • 78.6%
    • 100%


🎯 วิธีใช้ให้มีประสิทธิภาพในการเทรด

1. 🔥 การเข้าตามแนวโน้ม (กลยุทธ์ที่ดีที่สุด)

📈 ในแนวโน้มขาขึ้น:

  • รอให้ราคาย้อนกลับ pull back
  • ให้ความสำคัญกับโซนเหล่านี้:
    • 0.382 → 0.618 = โซนซื้อที่แข็งแกร่ง
  • เข้าซื้อเมื่อ:
    • แท่งเทียนกระทิงปรากฏ
    • สัญญาณซื้อที่แข็งแกร่ง (จากตัวบ่งชี้อื่นของคุณ)

📉 ในแนวโน้มขาลง:

  • รอให้ราคาย้อนกลับขึ้น
  • ให้ความสำคัญกับ:
    • 0.382 → 0.618 = โซนขายที่แข็งแกร่ง
  • เข้าขายเมื่อ:
    • แท่งเทียนหมีปรากฏ
    • สัญญาณขายที่แข็งแกร่ง


2. 🎯 การเข้าซื้อแบบสไนเปอร์ (การตั้งค่าขั้นสูง 🔥)

ผสมผสานระดับฟีโบนัชชีของคุณกับระบบที่มีอยู่:

ตัวอย่างการซื้อ:

  • แนวโน้ม = ขาขึ้น
  • ราคาย้อนกลับไปที่ 0.5 หรือ 0.618
  • ตัวบ่งชี้ของคุณแสดง:
    • ✅ สัญญาณซื้อที่แข็งแกร่ง
    • ✅ แท่งเทียนตัวใหญ่
    • ✅ ไส้เทียนบนต่ำ

👉 เข้าซื้อ (Sniper Entry)

ตัวอย่างการขาย:

  • แนวโน้ม = ขาลง
  • ราคาย้อนกลับไปที่ 0.5 หรือ 0.618
  • สัญญาณยืนยัน:
    • ❌ สัญญาณขายที่แข็งแกร่ง

👉 เข้าขาย


3. 💰 เป้าหมายทำกำไร

ใช้ระดับฟีโบนัชชีเป็นโซน TP:

  • TP1 → 0.236
  • TP2 → สูง/ต่ำก่อนหน้า (0.0 หรือ 1.0)
  • TP3 → เบรกเอาต์เกิน 1.0 (แนวโน้มต่อเนื่อง)


4. 🛑 การวางจุดหยุดขาดทุน

การวาง SL อย่างชาญฉลาด:

  • ต่ำกว่า 0.786 (สำหรับการซื้อ)
  • สูงกว่า 0.786 (สำหรับการขาย)

วิธีนี้ช่วยหลีกเลี่ยงการถูกตัดขาดทุนจากเสียงรบกวนของตลาดปกติ


5. ⚠️ หลีกเลี่ยงข้อผิดพลาดเหล่านี้

❌ การเทรดในตลาดที่เคลื่อนไหวไซด์เวย์
❌ การเข้าตลาดโดยไม่มีการยืนยัน
❌ การใช้ฟีโบนัชชีเพียงอย่างเดียว (ควรรวมกับสัญญาณเสมอ)
❌ การละเลยแนวโน้มในกรอบเวลาที่สูงกว่า


🧠 เคล็ดลับมือโปร (สไตล์ BOSS FX)

  • ผสมผสานกับ:
    • ตัวกรองแนวโน้ม EMA / HMA
    • สัญญาณซื้อ/ขายที่แข็งแกร่ง (ระบบของคุณ 🔥)
  • กรอบเวลาที่ดีที่สุด:
    • M5 (สเกลปิ้ง)
    • M15 (การเข้าซื้อแบบสไนเปอร์)
    • H1 (การยืนยัน)
  • สินทรัพย์ที่ดีที่สุด:
    • XAUUSD (ทองคำ)
    • EURUSD
    • GBPJPY


🚀 การรวมกลยุทธ์ที่ดีที่สุด (แนะนำ)

ใช้การตั้งค่านี้:

  • ระดับอัตโนมัติฟีโบนัชชี ✅
  • ตัวบ่งชี้ซื้อ/ขายที่แข็งแกร่งของคุณ ✅
  • การยืนยันแนวโน้มหลายกรอบเวลา ✅

👉 สิ่งนี้สร้าง ระบบเทรดสไนเปอร์ที่มีความแม่นยำสูง


📌 สรุป

ตัวบ่งชี้นี้ช่วยคุณ:

  • ระบุ โครงสร้างตลาดโดยอัตโนมัติ
  • เทรด การย้อนกลับอย่างมืออาชีพ
  • เข้าที่ โซนที่มีความน่าจะเป็นสูง
  • ขจัดความไม่แน่นอนจากการใช้ฟีโบนัชชี


มุ่งเน้นที่การชนะ!

สรุป

AI summary
The Fibonacci Automated Levels Indicator is a trading tool that automatically identifies the most recent market swing high and low within a specified lookback period and plots key Fibonacci retracement levels on the chart. It dynamically updates with market structure, removing subjectivity from manual Fibonacci drawing. The indicator detects trend direction—drawing Fibonacci levels from low to high in uptrends and high to low in downtrends—and plots standard retracement levels: 0.0, 23.6%, 38.2%, 50.0%, 61.8%, 78.6%, and 100%.

It supports all markets including Forex, Gold, Cryptocurrencies, and Indices, and works across all timeframes. Traders can use it to identify high-probability entry, exit, and reversal zones by focusing on pullbacks to key Fibonacci levels (notably 0.382 to 0.618). The indicator is designed to be combined with other signals and trend filters for confirmation, enhancing trade accuracy. It also provides guidance on take profit targets and stop loss placement to manage risk effectively.

Recommended usage includes trend-based entries, sniper entries combining Fibonacci levels with other indicators, and multi-timeframe trend confirmation. The indicator is suitable for scalping and various trading styles, helping traders automate market structure analysis and improve pullback trading decisions.
โปรไฟล์อินดิเคเตอร์

รีวิวจากลูกค้า

4.0
รีวิว: 3
5
0 %
4
100 %
3
0 %
2
0 %
1
0 %
รีวิวจากลูกค้า
April 13, 2026
A decent setup here should survive 0.5 Fib without looking messy. Risk and average R matter more than one clean screenshot.
April 11, 2026
I liked it more as a review layer for Fib based analysis than as something to follow blindly. Pullbacks feel easier to plan, and the final decision still feels like it belongs to the trader.
April 11, 2026
For Fib based analysis, the practical question is whether it reduces bad decisions. A 90 setup journal on New York open makes that clearer.

การสนทนา

คำถามที่พบบ่อย

Signal
Indices
Commodities
GBPUSD
RSI
Bollinger
Fibonacci
Scalping
AI
XAUUSD
NAS100
MACD
BTCUSD
Forex
Breakout
EURUSD
NZDUSD
Martingale
Prop
ZigZag
Supertrend
Fair Value Gap
SMC
Crypto
Grid
Stocks
ATR
USDJPY
VWAP
ผลิตภัณฑ์ที่มีให้บริการผ่าน cTrader Store รวมถึงบอทการเทรด อินดิเคเตอร์ และปลั๊กอิน มีให้บริการโดยนักพัฒนาบุคคลที่สามและมีไว้เพื่อวัตถุประสงค์ในการเข้าถึงข้อมูลและทางเทคนิคเท่านั้น cTrader Store ไม่ใช่โบรกเกอร์และไม่ได้ให้คำแนะนำการลงทุน คำแนะนำส่วนบุคคล หรือการรับประกันผลการดำเนินงานในอนาคต

เพิ่มเติมจากผู้เขียนคนนี้

อินดิเคเตอร์
Market Sessions is very important for traders.
"FractalArrowBuySell" โลโก้
ยอดนิยม
4.3
(3)
$20
/
$39
อินดิเคเตอร์
Signal
Fractal Arrow Buy and Sell Indicator
"Break of Structure" โลโก้
ยอดนิยม
4.7
(4)
$19
/
$25
อินดิเคเตอร์
The Break of Structure (BoSCHoCh) Indicator is a smart market structure tool designed to help traders easily spot trend.
อินดิเคเตอร์
MultiTF Pivot and SR Indicator
อินดิเคเตอร์
AI
ATR
+23
Candle Timer best used for Scalper
อินดิเคเตอร์
Prop
Forex
+13
Volume Meter
"Zigzag Trend" โลโก้
เรตติ้งสูง
4.5
(4)
$25
/
$45
อินดิเคเตอร์
AI
ATR
+23
The ZigZag Trend is a market structure tool that filters out small price fluctuations and highlights major swing.
cBot
AI
SMC
+18
Quick Trading Panel Cbot allows you to trade faster using a panel in a chart. This includes Trailing Trigger and Locked.
3
อัตราส่วน กำไรต่อขาดทุน
อินดิเคเตอร์
Area of Interest with the power of AI to detect the market interest.
อินดิเคเตอร์
AI
ATR
+27
Intraday MultiTimeframe Candle Status Indicator
อินดิเคเตอร์
The Market BIAS Detector is a smart trading assistant designed to identify the market.
"SpreadCalculator - BossFXTrader" โลโก้
เรตติ้งสูง
4.5
(4)
$19
อินดิเคเตอร์
Forex
Spread Calculator to calculate the difference between two prices or values.

นอกจากนี้คุณยังอาจชอบ

"TDI_Pro" โลโก้
ยอดนิยม
4.3
(3)
$39
/
$59
อินดิเคเตอร์
RSI
BTCUSD
+5
Traders Dynamic Index (TDI) — Divergence Edition
อินดิเคเตอร์
SMC
Prop
+16
Multi-Time Frame Candlesticks FVG with BSL/SSL Premium Suite
อินดิเคเตอร์
SMC
Prop
+15
Auto-detects Swing Highs/Lows to draw dynamic Support & Resistance levels with break tracking.
อินดิเคเตอร์
ADX
ATR
+5
EMA-cross signals scored on six confluence layers, with an ATR stop, three targets and a live panel
อินดิเคเตอร์
Forex
Real-Time Candlestick Pattern Detection with Custom Alerts & Trend Analysis for cTrader
"Major Tops and Bottoms" โลโก้
เรตติ้งสูง
4.2
(4)
$29
อินดิเคเตอร์
Signal
Scalping
Average accuracy of around 60% to 70% on 45min timeframes it is highly recommended to use stop losses
อินดิเคเตอร์
ATR
EMA
+2
Eight-EMA ribbon with ATR trade zones, a nine-symbol screener and a five-timeframe trend dashboard.
อินดิเคเตอร์
EMA
Channel
+3
Real-time squeeze detection, dual-horizon trend scoring & institutional breakout validation HUD dashboard.
อินดิเคเตอร์
MSS
VWAP
+5
VWAP mean-reversion signals combined with a ribbon-anchored volume profile, VAH/VAL, POC and HVN levels.
อินดิเคเตอร์
ATR
RSI
+2
This indicator works best as a trend-confirmation tool—wait for multiple signals!
อินดิเคเตอร์
XAUUSD
Professional Volume Profile Indicator - Shows volume distribution, POC, Value Areas & Buy/Sell pressure.
อินดิเคเตอร์
Forex
Crypto
+5
Fixed Range Volume Profile (FRVP) : analyzes price volume within a custom rectangle to find POC, VAH, and VAL.
อินดิเคเตอร์
Forex
Identify 34 candlestick patterns, track trends across timeframes, and get instant alerts with this powerful trading tool
อินดิเคเตอร์
Volume
Channel
+3
A higher-timeframe log-regression channel with a volume profile, Point of Control and session levels.
อินดิเคเตอร์
SMC
VWAP
+4
Killzone Session and key levels with VWAP – Precision Meets Price Action
"Tape Reading 4.2" โลโก้
ยอดนิยม
4.5
(4)
$47
/
$70
อินดิเคเตอร์
Volume
Key Levels
+1
Tape Reading indicator ,book and flow analysis
อินดิเคเตอร์
ATR
Signal
One of the best indicators we have ever developed, with a very high profit ratio.
อินดิเคเตอร์
RSI
Signal
+3
The Wyckoff Toolkit is the ultimate ally for traders seeking to decode the market through the lens of "smart money."

ราคา

ตั้งแต่ 29/05/2025
3.05M
ปริมาณการเทรด
68.12K
Pips ที่ได้กำไร
29
การขาย
880
ติดตั้งฟรี