

คำอธิบาย
1️⃣ ตัวบ่งชี้นี้ทำอะไร?
เครื่องมือนี้ สรุปทิศทางแท่งเทียนในหลายกรอบเวลา ในที่เดียวบนชาร์ตของคุณ
สำหรับแต่ละกรอบเวลา มันจะตรวจสอบ แท่งเทียนที่ปิดล่าสุด และแสดง:
สถานะความหมาย
🟢 กระทิง
ปิด > เปิด (ผู้ซื้อควบคุม)
🔴 หมี
ปิด < เปิด (ผู้ขายควบคุม)
⚪ โดจิ
ปิด ≈ เปิด (ลังเล)
กรอบเวลาที่แสดง:
- รายวัน
- H4
- H1
- M30
- M15
- M5
สถานะทั้งหมดจะแสดง บนชาร์ตโดยตรง ดังนั้นคุณไม่จำเป็นต้องเปลี่ยนกรอบเวลา
2️⃣ ทำไมเครื่องมือนี้ถึงทรงพลัง
🔥 แก้ปัญหาทั่วไปของเทรดเดอร์
เทรดเดอร์ส่วนใหญ่ถามว่า:
“ฉันกำลังเทรด ไปกับ หรือ สวนทาง กับแนวโน้มกรอบเวลาที่สูงกว่า?”
ตัวบ่งชี้นี้ตอบคำถามนั้น ทันที.
แทนที่จะเดา:
- คุณเห็น การสอดคล้องของแนวโน้ม
- คุณหลีกเลี่ยง การเข้าเทรดสวนแนวโน้ม
- คุณปรับปรุง จังหวะเวลาและความมั่นใจ
3️⃣ ตัวบ่งชี้ทำงานอย่างไร
📌 ตรรกะสถานะแท่งเทียน
- ใช้ แท่งเทียนที่ปิดล่าสุด (
Last(1)) - ไม่มีการวาดซ้ำ
- ยืนยันที่เชื่อถือได้
📌 ข้อมูลหลายกรอบเวลา
- ดึงข้อมูลแท่งเทียนจริงจากแต่ละกรอบเวลา
- อิสระจากกรอบเวลาชาร์ตที่คุณกำลังใช้งาน
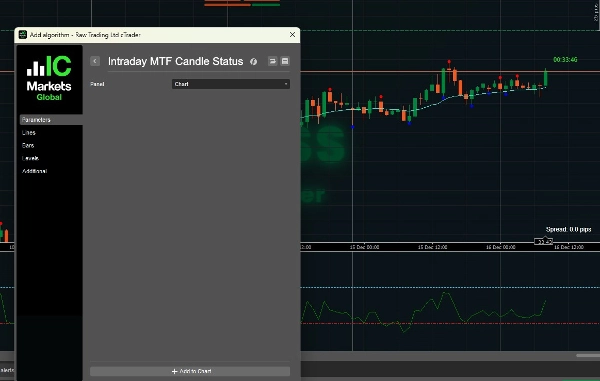
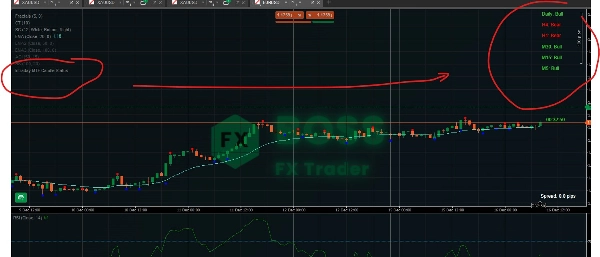
📌 การแสดงผลบนชาร์ต
- วาดป้ายข้อความที่ มุมบนขวา
- ใช้สีเพื่อให้อ่านได้ทันที
- อัปเดตทุกครั้งที่มีการเคลื่อนไหว
4️⃣ วิธีใช้ให้มีประสิทธิภาพ (สถานการณ์การเทรด)
🟢 สถานการณ์ 1: ยืนยันแนวโน้ม (กรณีใช้งานดีที่สุด)
✔ กฎ:
เทรดเฉพาะเมื่อกรอบเวลาสูงและต่ำเห็นด้วยกัน
ตัวอย่าง:
รายวัน: กระทิง
H4: กระทิง
H1: กระทิง
M15: กระทิง
M5: กระทิง
✅ สภาพแวดล้อมการซื้อที่มีโอกาสสูง
ใช้:
- การดึงกลับ
- การเบรคเอาท์
- การเข้าเทรดต่อเนื่อง
❌ หลีกเลี่ยงการขายที่นี่
🔴 สถานการณ์ 2: เตือนการสวนแนวโน้ม
รายวัน: กระทิง
H4: กระทิง
H1: หมี
M15: หมี
M5: หมี
⚠️ ตลาดอยู่ในช่วง การดึงกลับ ไม่ใช่การกลับตัว
การกระทำที่ดีที่สุด:
- รอให้ M5/M15 กลับมาเป็น กระทิงอีกครั้ง
- หลีกเลี่ยงการไล่ตามการขาย
- มองหา การตั้งค่าซื้อที่แนวรับ
⚪ สถานการณ์ 3: ตลาดผันผวน / ช่วงแนวข้าง
รายวัน: กระทิง
H4: โดจิ
H1: โดจิ
M15: หมี
M5: กระทิง
🚫 สภาพแวดล้อมคุณภาพต่ำ
แนะนำ:
- ลดขนาดตำแหน่ง
- หลีกเลี่ยงการเทรดเบรคเอาท์
- รอความชัดเจนของโครงสร้าง
5️⃣ ตัวอย่างกลยุทธ์สแคปปิ้ง (การเข้าเทรด M5)
🔹 การตั้งค่าซื้อที่เหมาะสม
- รายวัน → กระทิง
- H4 → กระทิง
- H1 → กระทิง
- M15 → กระทิง
- M5 → หมี → กลับเป็นกระทิง
📍 การเข้าเทรด:
- เมื่อ M5 กลับมาเป็น กระทิง
- รวมกับ:
-
- แนวรับ
- แฟรคทัล
- EMA / VWAP
🔹 การตั้งค่าขายที่เหมาะสม
ตรรกะตรงกันข้าม:
- กรอบเวลาสูง → หมี
- เข้าเทรดเมื่อการดึงกลับใน M5 เสร็จสมบูรณ์
6️⃣ การผสมผสานกรอบเวลาที่ดีที่สุด
สไตล์การเทรดกรอบเวลาที่เน้น
สแคปปิ้ง
H1 → M15 → M5
อินเทรดเดย์
H4 → H1 → M15
สวิง
รายวัน → H4 → H1
7️⃣ สิ่งที่เครื่องมือนี้ไม่ใช่
🚫 ไม่ใช่สัญญาณเข้าเทรดโดยตัวมันเอง
🚫 ไม่ใช่ตัวบ่งชี้กลับตัว
🚫 ไม่ใช่ตัวแทนของโครงสร้าง / การเคลื่อนไหวราคา
✅ มันคือ เครื่องมือชี้นำและยืนยัน
8️⃣ ตัวบ่งชี้ที่ดีที่สุดในการใช้ร่วมกัน
การจับคู่ที่แนะนำอย่างยิ่ง:
- ✅ แฟรคทัล (คุณใช้สิ่งนี้อยู่แล้ว)
- ✅ โครงสร้างตลาด (HH / LL)
- ✅ แนวรับและแนวต้าน
- ✅ EMA 50 / EMA 200
- ✅ VWAP
9️⃣ กฎการเทรดมืออาชีพโดยใช้เครื่องมือนี้
✔ เทรด เฉพาะในทิศทางของกรอบเวลาสูง
✔ ใช้กรอบเวลาต่ำเพื่อ กำหนดจังหวะเข้าเทรด
✔ ไม่สนใจสัญญาณเมื่อรายวัน & H4 ไม่ตรงกัน
✔ ไม่เทรดเกินไปในช่วงสัญญาณผสม
✔ ให้โครงสร้างยืนยันความโน้มเอียงของแท่งเทียน
🔟 สรุปสุดท้าย
IntradyMultiTimeframeCandleStatus = แดชบอร์ดความโน้มเอียงตลาด
มันให้คุณ:
- ความชัดเจนของแนวโน้มทันที
- การเทรดที่มีโอกาสสูงขึ้น
- การตัดสินใจที่มีอารมณ์น้อยลง
- การดำเนินการที่สะอาดขึ้น
ลองดูผลิตภัณฑ์ของเรา
สรุป
รีวิวจากลูกค้า
5 | 100 % | |
4 | 0 % | |
3 | 0 % | |
2 | 0 % | |
1 | 0 % |


