

Descrizione
Un calcolatore di spread è uno strumento utilizzato per calcolare la differenza tra due prezzi o valori, spesso usato in contesti finanziari nel trading. Può aiutare a determinare potenziali profitti, perdite e punti di pareggio, oltre a stimare quote e linee eque in scenari di trading.
Perché usare questo indicatore?
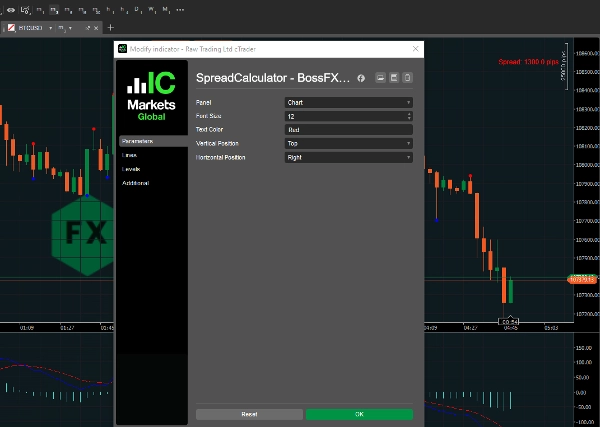
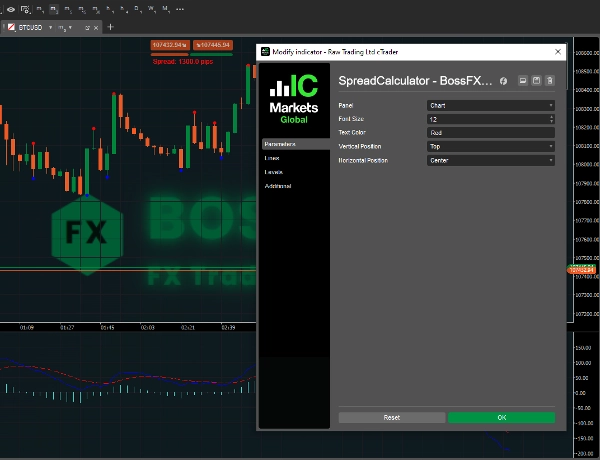
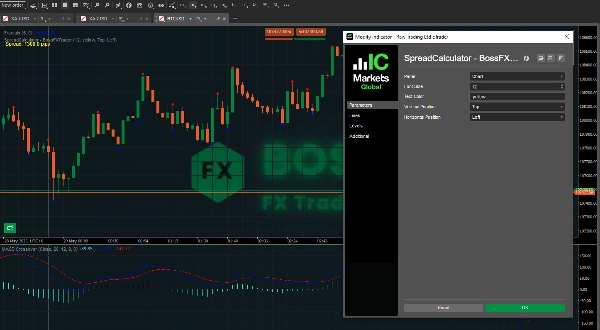
- Fare trading con precisione: Conoscere esattamente lo spread in tempo reale di ogni coppia di valute o azione.
- Modalità di posizione controllabili: Dimensione del font, colore del testo, posizione verticale e orizzontale.
Ecco perché usare un calcolatore di spread è vantaggioso:
- Comprendere i costi di trading:
Lo spread è un costo fondamentale del trading, e il calcolatore ti aiuta a visualizzare questo costo quando entri o esci da una posizione.
- Ottimizzare le strategie:
Analizzando gli spread storici, puoi ottimizzare le tue strategie di trading e ridurre i costi complessivi di trading.
- Prendere decisioni informate:
Il calcolatore fornisce dati sullo spread, permettendoti di prendere decisioni di trading informate e preparate.
- Calcolare i requisiti di margine:
Nel spread betting, un calcolatore di spread può aiutarti a determinare il margine richiesto per la tua operazione, ovvero la quantità di capitale che devi avere nel tuo conto.
- Valutare il potenziale profitto/perdita:
Il calcolatore può anche stimare il tuo potenziale profitto o perdita basato sullo spread attuale e sulla dimensione della tua operazione.
- Confrontare i broker:
Puoi usare un calcolatore di spread per confrontare gli spread offerti da diversi broker e scegliere quello che offre le migliori tariffe per le tue esigenze di trading.
- Analizzare le strategie con opzioni:
Nel trading di opzioni, i calcolatori di spread possono aiutarti ad analizzare varie strategie di spread verticali (come bull/bear spread).
- Comprendere i prezzi bid-ask:
Lo spread è la differenza tra il prezzo bid (quanto il venditore vuole ottenere) e il prezzo ask (quanto l'acquirente è disposto a pagare).
Riepilogo
Recensioni dei clienti
5 | 50 % | |
4 | 50 % | |
3 | 0 % | |
2 | 0 % | |
1 | 0 % |


![Logo di "[Stellar Strategies] MARSI Signal Plotter"](https://cdn.ctrader.com/image/webp/7b2b8da6-8f8e-4646-8d4a-4710c516c01e_25567)


