
Description
Marre des indicateurs en retard et des faux signaux ? Découvrez la fusion ultime de la théorie des points pivots et du momentum SuperTrend qui vous offre des points d'entrée et de sortie d'une précision professionnelle et d'une netteté laser.
🌟 QU'EST-CE QUI REND CET INDICATEUR SPÉCIAL ?
Technologie Double Puissance
- Précision des Points Pivots : Identifie les niveaux clés de support/résistance grâce à une détection sophistiquée des points pivots
- Momentum SuperTrend : Combine la volatilité ATR avec une précision de suivi de tendance
- Confirmation Intelligente des Signaux : Élimine les faux signaux grâce à une validation intégrée de la tendance
Fonctionnalités Professionnelles
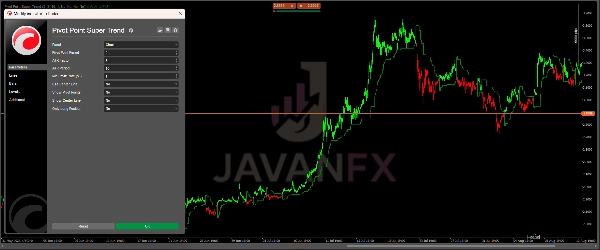
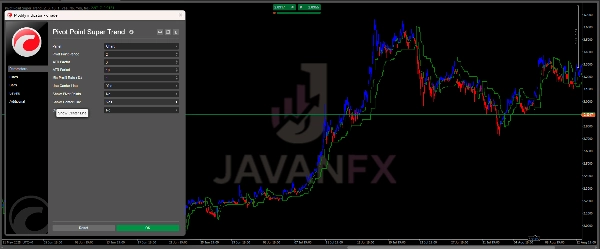
- 🎯 Signaux Visuels de Tendance : Lignes codées par couleur claires (Vert = Haussier, Rouge = Baissier)
- ⚡ Alertes en Temps Réel : Notifications instantanées sur le bureau pour les opportunités d'entrée
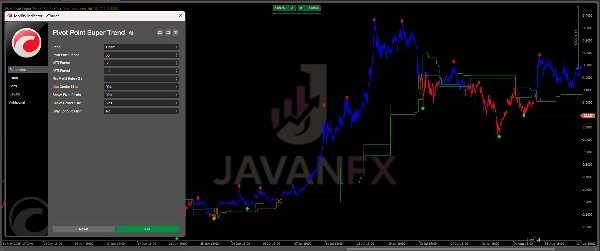
- 📊 Points Pivots Dynamiques : Détecte automatiquement les points de retournement importants du marché
- 🎚️ Entièrement Personnalisable : Ajustez la sensibilité pour correspondre à tout style de trading ou intervalle de temps
📈 PARFAIT POUR TOUS LES MARCHÉS & INTERVALLES DE TEMPS
Day Traders : Saisissez les tendances intrajournalières avec des entrées précises
Swing Traders : Surfez sur les grandes tendances en toute confiance
Traders Forex & Crypto : Fonctionne exceptionnellement bien sur les marchés volatils
Traders Actions & Futures : Fiable sur tous les instruments liquides
🎯 COMMENT UTILISER (Simple & Puissant)
Configuration de Base :
- Appliquez l'indicateur à votre graphique (de 1min à hebdomadaire)
- Ligne Verte : Prix au-dessus = signal d'ACHAT 📈
- Ligne Rouge : Prix en dessous = signal de VENTE 📉
Signaux d'Entrée :
- ACHAT lorsque la ligne devient VERTE et que le prix clôture au-dessus
- VENTE lorsque la ligne devient ROUGE et que le prix clôture en dessous
- Confirmation : Attendez l'alignement des points pivots pour une meilleure précision
Stratégie de Sortie :
- Stop Loss : En dessous/au-dessus de la ligne SuperTrend
- Take Profit : Lorsque la ligne de tendance change de couleur ou aux niveaux pivots clés
Fonctionnalités Avancées :
- Ligne Centrale : Utilisez-la comme support/résistance dynamique pour une prise de profit partielle
- Points Pivots : Les niveaux majeurs servent de confirmation pour les entrées/sorties
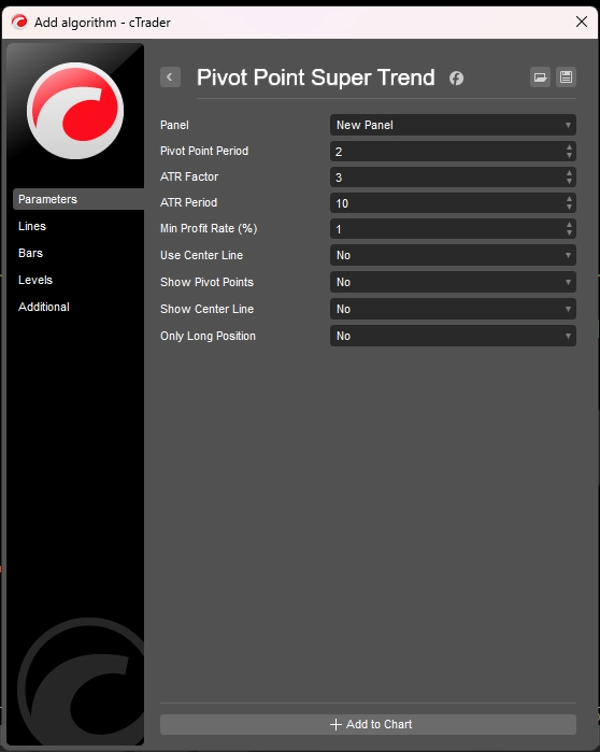
⚙️ RÉGLAGES OPTIMAUX
Day Trading (1min - 15min) :
- Période Pivot : 2-3
- Facteur ATR : 2.5-3.5
- Période ATR : 10-15
Swing Trading (1H - Quotidien) :
- Période Pivot : 3-5
- Facteur ATR : 3-4
- Période ATR : 14-20
Position Trading (Hebdomadaire) :
- Période Pivot : 5-7
- Facteur ATR : 4-5
- Période ATR : 20-25
💡 ASTUCES DE PRO
- Combinez avec les supports/résistances majeurs pour des résultats explosifs
- Utilisez sur plusieurs intervalles de temps pour la confluence (ex. : tendance 1H + entrée 15min)
- Ajustez le Facteur ATR en fonction de la volatilité du marché
- Testez différentes configurations pour votre instrument spécifique
Résumé
Key functionalities include color-coded trend lines—green for bullish and red for bearish trends—real-time desktop alerts for trade opportunities, and dynamic pivot points that automatically detect significant market turning points. It is fully customizable, allowing traders to adjust sensitivity settings to suit various trading styles and timeframes.
This indicator supports all markets and timeframes, making it suitable for day traders, swing traders, forex, crypto, stock, and futures traders. Typical usage involves applying the indicator to charts from 1-minute to weekly intervals, interpreting green lines and price above as buy signals, and red lines with price below as sell signals, with pivot point alignment for confirmation. Exit strategies include setting stop losses relative to the SuperTrend line and taking profits at trend changes or pivot levels.
Optimal settings vary by trading style, with specific pivot periods, ATR factors, and ATR periods recommended for day trading, swing trading, and position trading. Additional features include a center line for dynamic support/resistance and partial profit-taking.
Avis clients
5 | 100 % | |
4 | 0 % | |
3 | 0 % | |
2 | 0 % | |
1 | 0 % |


