
Zero Lag LSMA
Indicateur
6 achats
Version 1.0, Aug 2025
Windows, Mac
4.6
Avis : 3
Description
Le Zero Lag LSMA (Moyenne Mobile des Moindres Carrés) est un indicateur technique de pointe conçu pour les traders recherchant une meilleure réactivité et précision dans l'analyse des tendances. Contrairement aux moyennes mobiles traditionnelles qui accusent un retard par rapport à l'action des prix, il minimise ce retard en appliquant un double processus de régression linéaire, ce qui le rend idéal pour identifier la direction de la tendance et les retournements potentiels en temps réel. Cet indicateur est parfait pour le forex, les actions, les matières premières et d'autres marchés.
Caractéristiques principales
- Performance sans retard : Réduit le délai inhérent aux moyennes mobiles traditionnelles, fournissant des signaux plus rapides pour les changements de tendance.
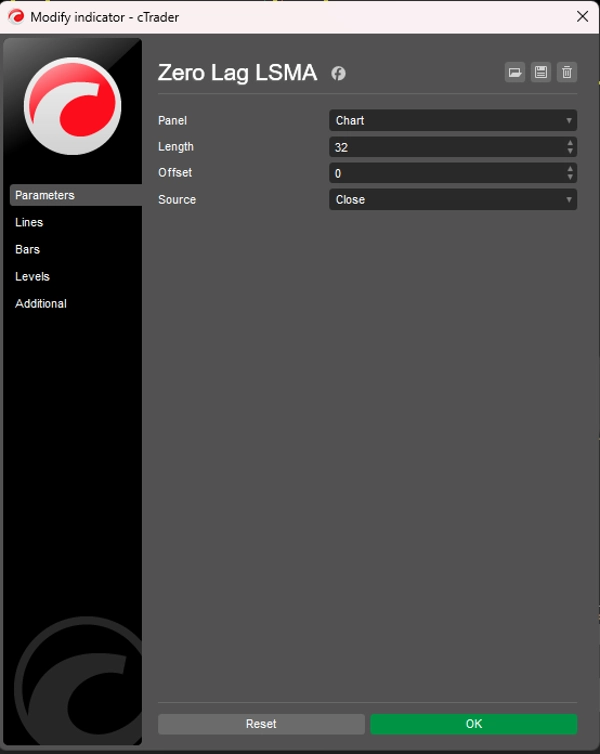
- Paramètres personnalisables : Ajustez la longueur, le décalage et la source de prix (Ouverture, Haut, Bas, Clôture) pour adapter à votre stratégie de trading.
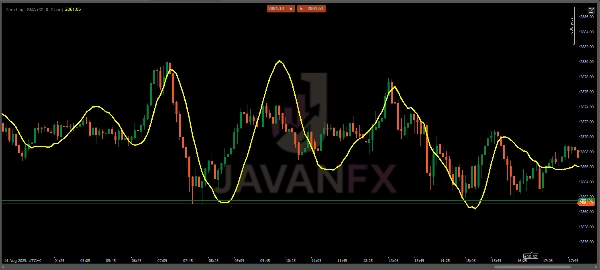
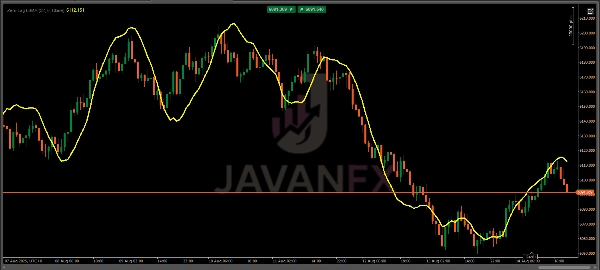
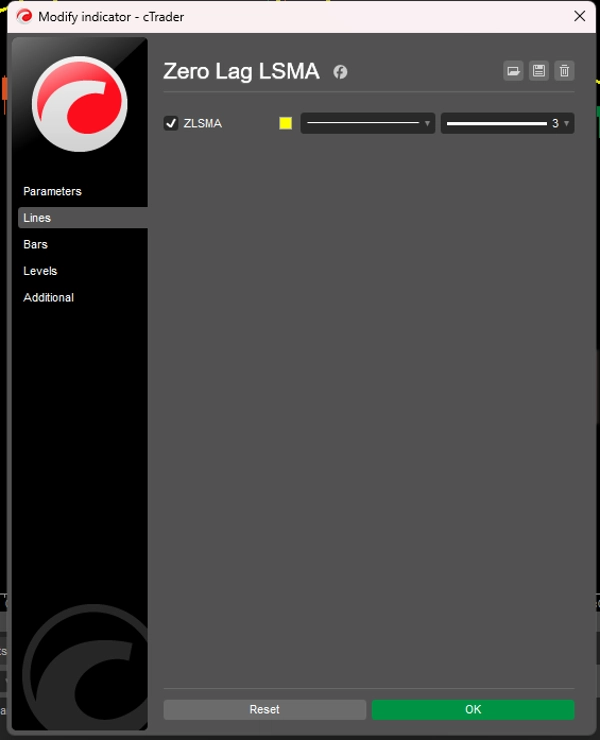
- Visuellement intuitif : S'affiche comme une ligne jaune lisse superposée au graphique des prix pour une interprétation facile.
- Application polyvalente : Convient au scalping, trading journalier, swing trading et stratégies à long terme sur différentes périodes.
Comment l'utiliser
- Identification de la tendance :
-
- Lorsque la ligne ZLSMA penche vers le haut, cela indique une tendance haussière.
- Une pente vers le bas suggère une tendance baissière.
- Un mouvement plat ou chaotique peut indiquer une consolidation ou l'absence de tendance.
- Signaux d'entrée/sortie :
-
- Signal d'achat : Entrez en position longue lorsque le prix franchit la ligne ZLSMA à la hausse, surtout après une tendance haussière confirmée.
- Signal de vente : Entrez en position courte lorsque le prix franchit la ligne ZLSMA à la baisse lors d'une tendance baissière.
- Signal de sortie : Envisagez de sortir lorsque le prix repasse à travers la ZLSMA ou lorsque la ligne s'aplatit, indiquant un retournement potentiel de tendance.
- Confirmation :
-
- Combinez la ZLSMA avec d'autres indicateurs (par ex., RSI, MACD) ou niveaux de support/résistance pour confirmer les signaux et éviter les faux cassures.
- Utilisez sur des périodes plus longues (H1, H4, D1) pour des signaux de tendance plus forts ou sur des périodes plus courtes (M5, M15) pour le scalping.
Stratégies de trading
- Suivi de tendance : Utilisez la ZLSMA pour suivre les tendances fortes en entrant lors des replis vers la ligne ZLSMA dans la direction de la tendance.
- Trading de retournement : Recherchez une divergence des prix par rapport à la ligne ZLSMA combinée à des figures de chandeliers (par ex., pin bars, chandeliers engloutissants) pour des configurations de retournement.
- Trading de cassure : Surveillez les cassures de prix au-dessus/en dessous de la ZLSMA pendant les périodes de forte volatilité pour des points d'entrée potentiels.
Conseils pour une utilisation optimale
- Ajustez la longueur selon les conditions du marché : Utilisez une longueur plus courte (par ex., 10-20) pour les marchés rapides ou le scalping, et une longueur plus longue (par ex., 50-100) pour des tendances plus lisses sur des périodes plus longues.
- Testez sur un compte démo : Avant d'utiliser en trading réel, testez la ZLSMA sur un compte démo pour comprendre son comportement sur vos marchés préférés.
- Évitez le sur-trading dans les marchés instables : La ZLSMA fonctionne mieux dans les marchés en tendance ; utilisez des filtres supplémentaires (par ex., ADX) pour éviter les faux signaux dans les marchés latéraux.
Résumé
Résumé IA
The Zero Lag LSMA (Least Squares Moving Average) is a technical indicator designed to enhance trend analysis by minimizing the lag typical of traditional moving averages. It uses a double linear regression process to provide faster and more responsive signals, making it suitable for real-time identification of trend direction and potential reversals. The indicator is applicable across various markets including forex, stocks, and commodities.
Key features include customizable parameters such as length, offset, and price source (Open, High, Low, Close), allowing adaptation to different trading strategies. It displays as a smooth yellow line overlaid on the price chart for clear visual interpretation. The indicator supports multiple trading styles and timeframes, from scalping to long-term strategies.
Traders use the Zero Lag LSMA to identify trends by observing the slope of the line: upward for bullish trends, downward for bearish, and flat for consolidation. Entry and exit signals are generated when price crosses the LSMA line, with additional confirmation recommended through other indicators or support/resistance levels. The indicator supports trend following, reversal, and breakout trading strategies, with adjustable settings to optimize performance under varying market conditions.
Profil de l'indicateur
Avis clients
4.6
Avis : 3
5 | 67 % | |
4 | 33 % | |
3 | 0 % | |
2 | 0 % | |
1 | 0 % |
Avis clients
October 10, 2025
Zero lag, full clarity ⚡ LSMA tracks price action like a scalpel — sharp, fast, and smooth. Great trend filter for any timeframe!
August 27, 2025
The only reason it stays interesting is the setup needs less second guessing. A normal demo run is enough to see the weak spots.
August 16, 2025
Not bad if the rules are already clear. Spread and slippage need a line in the notes.
Discussion
Questions fréquentes
Les produits disponibles sur cTrader Store, notamment les bots de trading, les indicateurs et les plug-ins, sont fournis par des développeurs tiers et mis à disposition à titre informatif et à des fins d'accès technique uniquement. cTrader Store n'est pas un courtier et ne fournit aucun conseil en investissement, aucune recommandation personnelle ni aucune garantie quant aux performances futures.


Prix
Depuis le 14/07/2025
60
Ventes