
Description
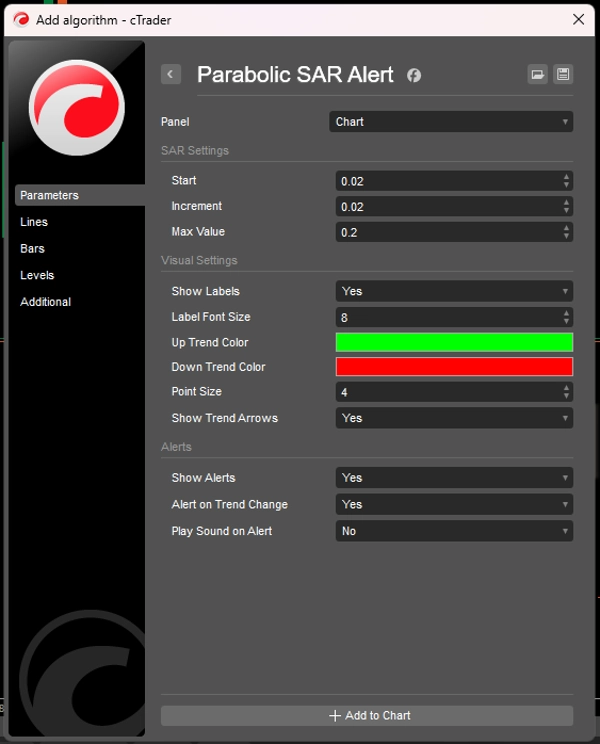
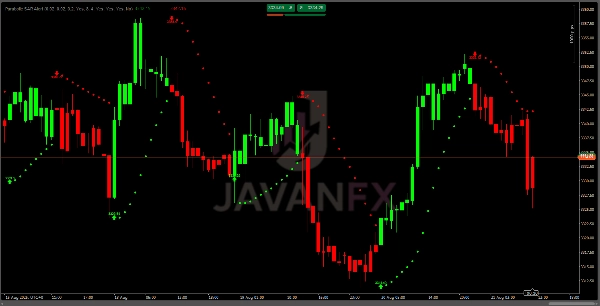
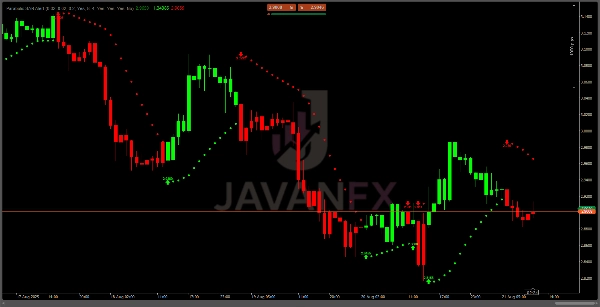
Cet indicateur suit les tendances des prix et identifie les retournements potentiels en utilisant le célèbre algorithme Parabolic SAR. Personnalisable avec des valeurs de départ, d'incrément et maximales ajustables, il présente des signaux codés par couleur vibrante (vert citron pour les tendances haussières, rouge pour les tendances baissières) et des étiquettes optionnelles pour marquer les changements de tendance. Parfait pour le forex, les actions et d'autres marchés, il inclut des alertes intégrées pour vous notifier des changements de tendance, vous assurant de ne jamais manquer un mouvement critique.
QUI A BESOIN DE CET INDICATEUR ?
- Les traders ayant du mal à identifier les changements de tendance
- Les professionnels recherchant des signaux de retournement fiables
- Les débutants cherchant une guidance visuelle claire pour le trading
- Les traders algorithmiques ayant besoin de points de déclenchement précis
- Toute personne fatiguée de manquer les grands retournements du marché
⏰ OPTIMISATION DU CADRAN TEMPOREL :
Scalping (graphiques de 1 à 5 minutes) :
Départ : 0.01-0.015
Incrément : 0.015-0.02
Maximum : 0.1-0.15
Day Trading (graphiques de 15 à 30 minutes) :
Départ : 0.02-0.03
Incrément : 0.02-0.03
Maximum : 0.15-0.2
Swing Trading (graphiques de 1 à 4 heures) :
Départ : 0.03-0.04
Incrément : 0.03-0.04
Maximum : 0.2-0.25
Analyse Multi-Cadrans Temporels :
- Appliquer l'indicateur à un cadran temporel supérieur pour la direction de la tendance
- Utiliser un cadran temporel inférieur pour un timing d'entrée précis
- Parfait pour le trading de confluence
À combiner avec :
- Moyennes Mobiles pour la confirmation de tendance
- RSI/MACD pour la validation du momentum
- Niveaux de Support/Résistance pour de meilleures entrées
- Indicateurs de Volume pour la confirmation de la force
🚨 ASTUCES DE PRO :
- Évitez les marchés instables : le SAR fonctionne mieux dans des conditions de tendance
- Attendez la confirmation : n'entrez pas au premier changement de point - attendez la confirmation du prix
- Utilisez plusieurs cadrans temporels : la direction du SAR sur un cadran supérieur détermine le biais
- Ajustez les paramètres : affinez les réglages pour différents instruments
- Testez d'abord en arrière : testez les stratégies avant le trading en direct
Bonne chance !!
Résumé
The indicator is optimized for various timeframes: scalping (1–5 minutes), day trading (15–30 minutes), and swing trading (1–4 hours), with recommended parameter ranges for each. It supports multi-timeframe analysis, allowing traders to use higher timeframes for trend direction and lower timeframes for precise entries. The indicator can be combined with moving averages, RSI, MACD, support/resistance levels, and volume indicators for enhanced confirmation.
Intended for traders seeking clear, reliable reversal signals, it is suitable for beginners and professionals alike. Users are advised to avoid choppy markets, wait for price confirmation before entering trades, adjust parameters per instrument, and backtest strategies prior to live trading.
Avis clients
5 | 100 % | |
4 | 0 % | |
3 | 0 % | |
2 | 0 % | |
1 | 0 % |


![Logo de "[Stellar Strategies] Market Session Ultimate"](https://cdn.ctrader.com/image/webp/61ffd537-0125-4246-9e72-42eca1791d64_28232)


