
Multi Timeframe Trend Dots là một chỉ báo xu hướng mạnh mẽ và tối giản được xây dựng cho cTrader. Nó cho phép các nhà giao dịch theo dõi trực quan hướng xu hướng trên tối đa 4 khung thời gian có thể chọn bằng cách sử dụng các đường chấm mã màu đơn giản nhưng hiệu quả.
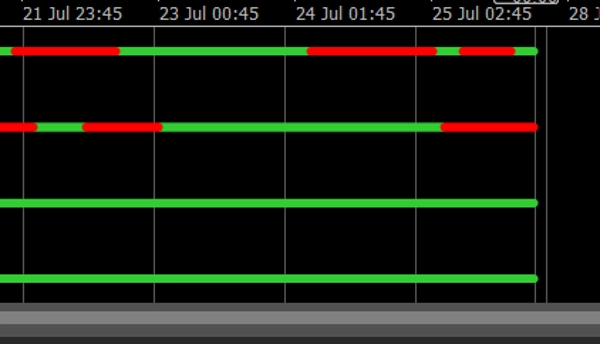
✅ Xanh lá = Xu hướng tăng
✅ Đỏ = Xu hướng giảm
✅ Bố cục sạch sẽ trong một cửa sổ phụ duy nhất
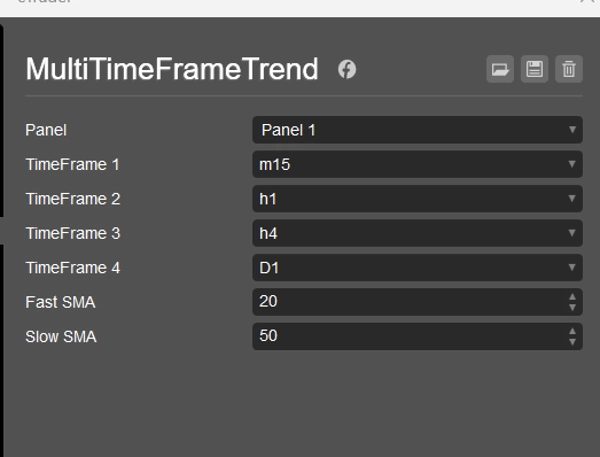
✅ Có thể tùy chỉnh cài đặt SMA nhanh/chậm
✅ Hoạt động trên bất kỳ ký hiệu và khung thời gian nào
Dù bạn là người giao dịch lướt sóng, giao dịch trong ngày, hay giao dịch theo xu hướng, chỉ báo này cung cấp cho bạn cái nhìn nhanh về sự đồng bộ đa khung thời gian — lý tưởng để thực hiện các lệnh vào lệnh tự tin hoặc lọc ra các thiết lập không tốt.
💼 Bao gồm:
- Logic xu hướng dựa trên giao cắt SMA
- Đặt chấm ở 4 cấp độ (điều chỉnh để dễ đọc)
- Nhãn khung thời gian ở cuối mỗi đường xu hướng
- Hoàn toàn tương thích với tất cả các phiên bản cTrader
🎁 Người bạn đồng hành hoàn hảo cho việc xây dựng chiến lược hoặc giao dịch thủ công.
5 | 0 % | |
4 | 100 % | |
3 | 0 % | |
2 | 0 % | |
1 | 0 % |


![Logo "[Stellar Strategies] Inside Bar with Signals"](https://cdn.ctrader.com/image/webp/1d9e8bfa-3b2c-4440-bb37-5856902008a7_30683)


