
Mô tả
MACD Custom MTF (Multiple Time Frame) v1.1 là một công cụ tiên tiến kết hợp sức mạnh đã được chứng minh của MACD cổ điển với lợi thế quan trọng của phân tích đa khung thời gian và trực quan hóa hiện đại, trực quan. Được thiết kế cho các nhà giao dịch tinh tường yêu cầu độ chính xác, giải thích nhanh chóng và khả năng tùy chỉnh công cụ theo chiến lược độc đáo của họ.
Có gì mới trong Phiên bản 1.1:
- Hình ảnh Mượt mà 100%: Sửa các đường MACD bị đứt/ngắt quãng – các đường giờ đây hoàn toàn liên tục trong các thay đổi xu hướng.
- Tăng cường Khả năng Hiển thị: Tăng kích thước các chấm tín hiệu Mua/Bán, làm dày Đường Tín hiệu và Biểu đồ Histogram để có cái nhìn rõ ràng. Làm mờ Đường Zero để giảm mỏi mắt.
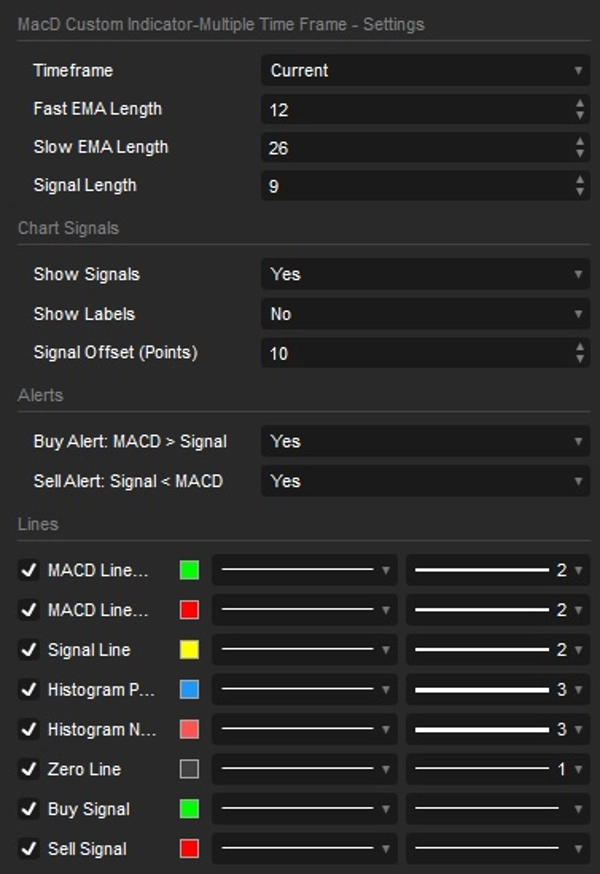
- Cảnh báo Thông minh & Đơn giản: Dọn dẹp cửa sổ cài đặt. Chỉ cần bật "Buy Alert" hoặc "Sell Alert" và chỉ báo tự động xử lý các Popup trên màn hình và thông báo âm thanh chính xác.
- Cài đặt Có tổ chức: Tất cả các tham số giờ đây được nhóm gọn gàng thành các danh mục trực quan để trải nghiệm người dùng tốt hơn nhiều.
- Địa phương hóa Tiếng Anh đầy đủ: Tất cả các thông báo nhật ký, popup và lỗi đã được địa phương hóa hoàn toàn sang tiếng Anh.
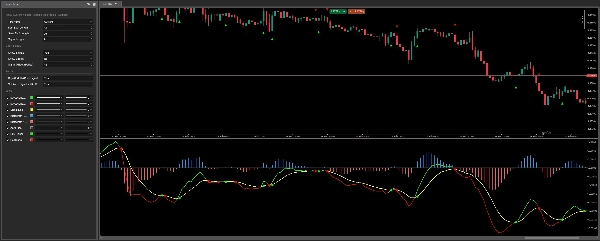
Phân tích Đa Khung Thời gian (MTF) trên một Biểu đồ Đơn:
Ngừng việc chuyển đổi biểu đồ! Hiển thị dữ liệu MACD từ khung thời gian cao hơn (ví dụ: H1, H4, D1) trực tiếp lên biểu đồ làm việc hiện tại của bạn (ví dụ: M5, M15). Nhận bối cảnh thị trường rộng lớn vô giá, xác định các xu hướng cơ bản chi phối và hiệu quả lọc bỏ nhiễu gây hiểu lầm từ các khung thời gian thấp hơn. Hoàn toàn có thể cấu hình – chọn từ danh sách đầy đủ các khung thời gian, từ phút đến hàng tháng.
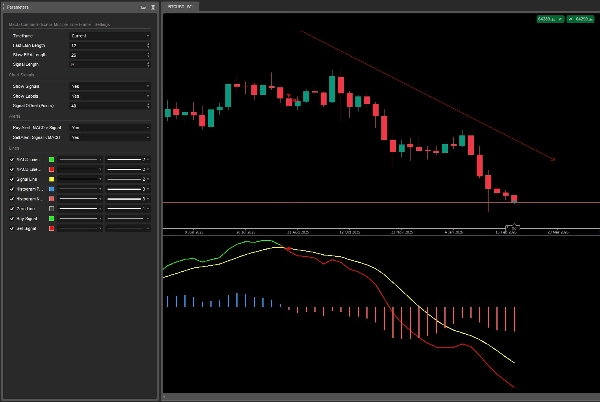
Tô màu Động cho MACD & Đường Tín hiệu:
Xác nhận xu hướng ngay lập tức: Đường MACD thay đổi màu sắc động khi cắt qua đường tín hiệu, minh họa sinh động động lực tăng hoặc giảm. Không còn phải đoán – màu đường ngay lập tức cho bạn biết MACD đang ở trên (tăng) hay dưới (giảm) đường tín hiệu.
Biểu đồ Histogram Rõ ràng:
Dễ dàng hình dung sự phân kỳ (độ mạnh) giữa MACD và đường tín hiệu. Chỉ báo tô màu các thanh dày dựa trên việc chúng là dương (xanh) hay âm (đỏ), cung cấp cái nhìn sâu sắc về sự thay đổi động lực chỉ trong một cái nhìn.
Tín hiệu Crossover Trực quan Không thể Nhầm lẫn:
Không bao giờ bỏ lỡ một tín hiệu crossover quan trọng nữa! Chỉ báo tự động làm nổi bật các điểm cắt giữa MACD và Đường tín hiệu. Nó vẽ các chấm riêng biệt, rất dễ nhìn trực tiếp trên biểu đồ giá của bạn (với độ lệch có thể điều chỉnh) và cung cấp nhãn văn bản "Buy"/"Sell" tùy chọn để rõ ràng tối đa.
Cảnh báo Thông minh Tích hợp:
Tính năng thông báo Popup và Âm thanh tích hợp, dễ dàng cho tín hiệu Mua và Bán. Luôn được thông báo về mọi cơ hội mà không cần dán mắt vào màn hình! Chỉ cần bật cảnh báo trong cài đặt và để chỉ báo theo dõi cho bạn.
Tùy chỉnh Toàn diện trong Tầm Tay Bạn:
- Tùy chỉnh độ dài EMA Nhanh, EMA Chậm và Đường Tín hiệu theo yêu cầu chính xác của bạn.
- Tất cả cài đặt được tổ chức gọn gàng thành các nhóm logic (Cài đặt MACD, Tín hiệu Biểu đồ, Cảnh báo) để điều chỉnh nhanh chóng.
- Bật/tắt hiển thị các yếu tố trực quan riêng lẻ: Đường MACD & Đường Tín hiệu, Histogram, Tín hiệu Crossover và Nhãn.
- Điều chỉnh độ lệch tín hiệu để phù hợp hoàn hảo với thẩm mỹ và sở thích biểu đồ của bạn.
Tóm tắt
Key features include dynamic coloring of the MACD and signal lines to indicate bullish or bearish momentum, a crystal-clear histogram that visualizes the divergence between MACD and its signal line with color-coded bars, and unmistakable visual crossover signals marked by distinct dots or arrows on the price chart. The indicator supports integrated alerts with popup and sound notifications for buy and sell signals, configurable via a streamlined settings interface.
Users can fully customize the indicator by adjusting Fast EMA, Slow EMA, and Signal Line lengths, toggling visibility of visual elements (lines, histogram, signals, labels), and modifying colors and line thickness. The settings are organized into intuitive categories for ease of use. This indicator supports a wide range of timeframes from minutes to monthly and is suitable for various markets including Forex, indices, commodities, stocks, and cryptocurrencies.
Đánh giá của khách hàng
5 | 100 % | |
4 | 0 % | |
3 | 0 % | |
2 | 0 % | |
1 | 0 % |


