present
Sign up and get $50 off your first purchase
Trading product for RSI Indicator Indicator SMA RSI, image 1
RSI Indicator
Indicator
Version 1.0, May 2026
Windows, Mac
Trading product for RSI Indicator Indicator SMA RSI, image 2
Trading product for RSI Indicator Indicator SMA RSI, image 3
100
Sales
202
Free installs

Description

Showcase:


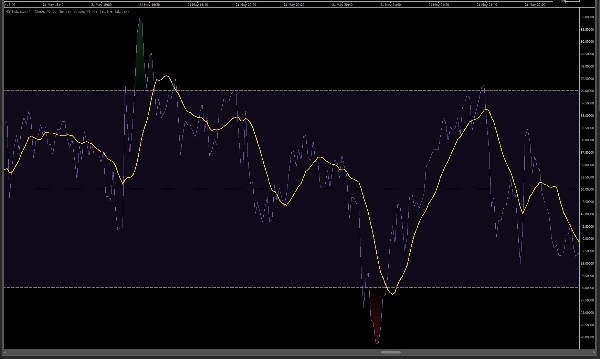
RSI Indicator - this indicator is an advanced yet clean implementation of the classic Relative Strength Index (RSI) oscillator for the cTrader platform. It has been developed in strict accordance with the original indicator from TradingView (based on their official specification).

Thanks to the use of the RMA (Running Moving Average) smoothing model, this indicator behaves and plots exactly like its TradingView counterpart. We have also ensured a fully matching visual experience.

Main features and functions:

  • 100% TradingView Compatibility: The algorithm uses the exact same calculation logic as the original TV indicator (based on the RMA formula).
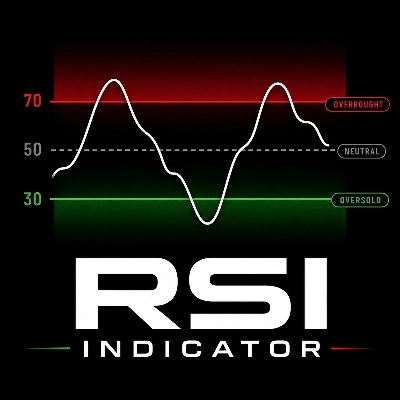
  • Stunning Visual Design (Dynamic Gradients): An innovative 30-level color shading system is applied. The higher the RSI moves into the overbought zone (above 70), the more intense the red background becomes. The lower it drops into the oversold zone (below 30), the deeper the green becomes. The middle range retains the classic purple tone.
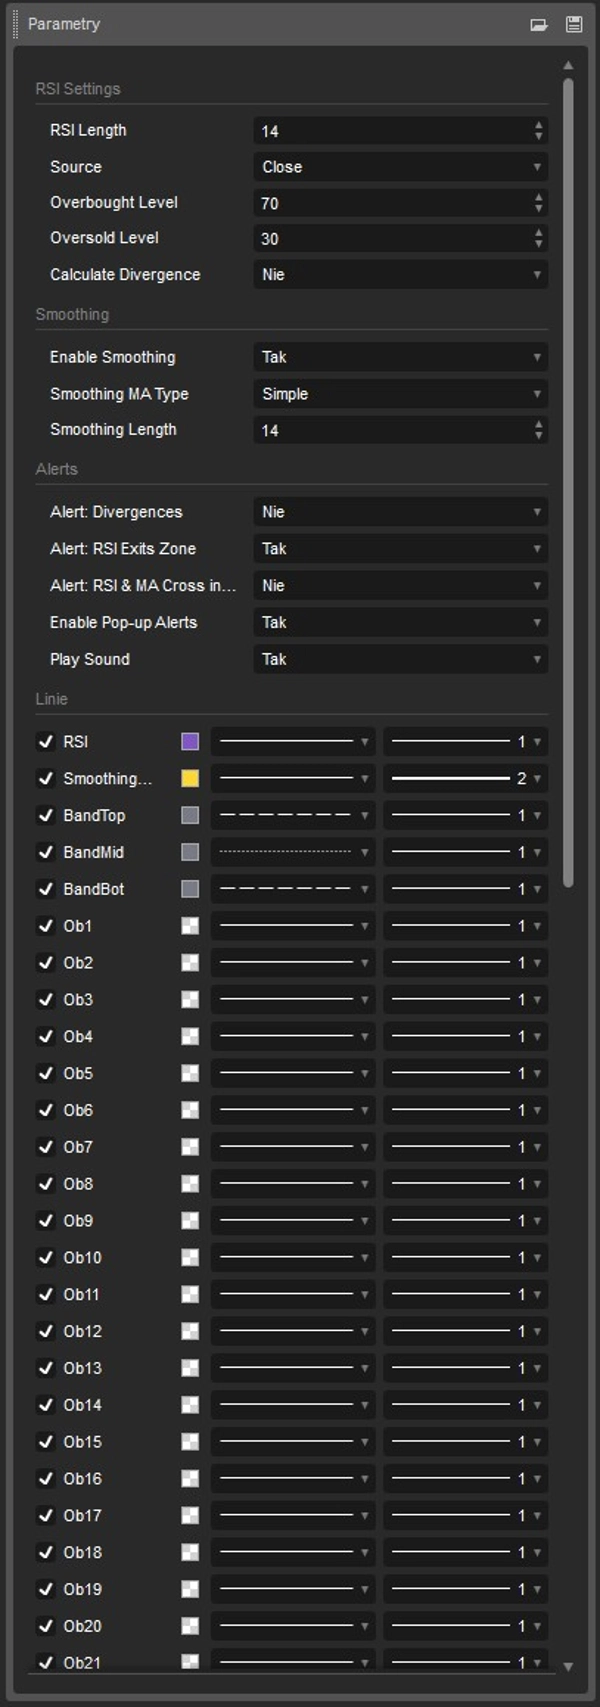
  • Built-in Moving Average (MA): As in the latest TV versions, you can enable a moving average line (e.g., SMA) that smooths the RSI line and helps identify trends within the oscillator itself.
  • Automatic Divergence Detection: The indicator can automatically scan the chart for regular divergences. When it detects a mismatch between price and RSI trend strength, it draws lines and markers (Bullish: green, Bearish: red) directly in the indicator window.
  • Powerful Alert System (Pop-up & Sound): Stay up to date at all times. The indicator will notify you when:
    • RSI exits the overbought/oversold zones (generating classic buy/sell signals),
    • The RSI line crosses the MA line deep within these zones,
    • A new divergence is detected.

Who is this indicator for?

If you are used to analyzing RSI on TradingView, are looking for perfectly matching signals in cTrader, and value a clean, visually appealing design (without manually tweaking colors), this indicator is an ideal solution.

Simple to use, precise in operation, and faithful to the original!

cGuru

Summary

AI summary
The RSI Indicator is a cTrader implementation of the classic Relative Strength Index oscillator, designed to replicate TradingView’s original indicator using the Running Moving Average (RMA) smoothing method. It provides 100% calculation compatibility with TradingView, ensuring identical signal behavior and visual presentation. Key features include a dynamic 30-level gradient color scheme that visually distinguishes overbought (red) and oversold (green) zones, with a neutral purple mid-range. The indicator supports an optional moving average line (e.g., SMA) to smooth the RSI curve and highlight trends within the oscillator. It also offers automatic detection of regular divergences between price and RSI trends, marking bullish and bearish divergences directly on the chart. A built-in alert system notifies users via pop-up and sound when the RSI exits overbought/oversold zones, crosses the moving average within these zones, or when new divergences are detected. This indicator is suitable for traders familiar with TradingView’s RSI who seek an accurate, visually clear, and feature-rich RSI tool within the cTrader platform.
Indicator profile
Indicator category
Support & resistance
Output type
Visualisation
Data requirements
Tick data
Supported signals
Reversal
Divergence

Customer reviews

0.0
Reviews: 0
Customer reviews
No reviews for this product yet. Already tried it? Be the first to tell others!

Discussion

FAQ

SMA
RSI
Moving Average
Products available through cTrader Store, including trading bots, indicators and plugins, are provided by third-party developers and made available for informational and technical access purposes only. cTrader Store is not a broker and does not provide investment advice, personal recommendations or any guarantee of future performance.

More from this author

Indicator
AI
ATR
+27
Trend Is Your Friend cBot - INDICATOR - Professional Grid, Pyramid, Swing & Scalp Trading Indicator
Indicator
AI
ATR
+27
Supertrend Indicator
Indicator
AI
ATR
+27
Nadaraya-Watson Envelope Indicator
Indicator
AI
ATR
+27
Market Cipher B
Indicator
AI
ATR
+27
Supertrend Indicator
cBot
AI
ATR
+27
RSI Simple Grid cBot - grid trading strategy with RSI (Relative Strength Index) signals
26.8%
ROI
4.41
Profit factor
Indicator
AI
ATR
+26
MacD Custom Indicator-Multiple Time Frame
Indicator
AI
ATR
+19
Market Cipher A
cBot
AI
ATR
+27
SmartHedge cBot - Your Trading Companion
1.26
Profit factor
Indicator
EMA
SMA
+3
MACD indicator modeled after TradingView, featuring a 4-color momentum histogram, sound/pop-up crossover alerts.
cBot
ATR
RSI
+5
Trend is your friend cBot - Professional Grid, Pyramid, Swing & Scalp Trading System
28%
ROI
5.27
Profit factor

You may also like

Indicator
Forex
BTCUSD
+9
Market Sentiment Pro: Predict tops & bottoms using crowd psychology. Contrarian signals with 70-80% accuracy. Early Acce
Indicator
Doji
Volume
+5
Instantly spot high-liquidity institutional moves with clean, non-obtrusive triangle alerts on cTrader charts.
Indicator
AI
ATR
+23
The ZigZag Trend is a market structure tool that filters out small price fluctuations and highlights major swing.
Indicator
The Advanced Volume Profile Indicator calculates POC, Median, and Mode, revealing key price levels for smarter trading.
Indicator
Customizable window inside your platform, access to any website Calendar
Indicator
Indices
this indicator shows previous day high low and closed with precise manner.
Indicator
Forex
EURUSD
+4
A precision overlay tool that combines session-aware VWAP logic and standard deviations.
Indicator
RSI
RSI on the main chart with 45/55 momentum levels, overbought/oversold levels, averaged RSI, and multi-timeframe support.
Indicator
Crypto
Signal
+3
Candlestick Signal Finder: cTrader indicator that automatically detects and color-codes key Japanese candlestick pattern
Indicator
BOS
MSS
+5
Your entire ICT session map, structure engine, and key levels — No manual work. One indicator. Every session!
Indicator
BB Breakout Oscillator with alerts! Spot trend reversals using Bollinger Bands. Bullish/Bearish crossovers Alerts.
Indicator
Prop
Forex
+11
⚡Nebula Range Filter is a professional trend filter indicator for cTrader⚡
Indicator
Forex
EURUSD
+4
Check the correlations between dozens of assets in one elegant display.
Indicator
Aggressive
Supertrend
+5
Stop trading with tunnel vision! 🚫 The Heat Map Dashboard is an institutional-grade visual trading assistant
Indicator
Channel
Imbalance
+2
Adaptive volatility channel based on moving average and standard deviation (σ).
Indicator
ICT ALL KİLL ZONES, LONDON , ASİA, NY AM, NY LUNCH, NY PM
Indicator
Volume
Imbalance
+1
Volume profile indicator that auto-detects the latest trendline. Shows POC, Value Area (VAH/VAL), and High Volume Nodes
Indicator
ADX
ATR
+1
Indicador de Sinais Visuais para Spotcrude (WTI) ou SpotBrent com filtros de tendência, operacional de 10 e 15 minutos.

Price

100
Sales
202
Free installs