
Weekly Daily Levels
Chỉ báo
2 lượt mua
Phiên bản 1.0, Aug 2025
Windows, Mac
5.0
Đánh giá: 2
Mô tả
Bạn có đang dựa vào giá OHLC hàng ngày và hàng tuần cũng như giá điểm giữa trong chiến lược giao dịch của mình không? Mệt mỏi vì phải đánh dấu chúng thủ công mỗi khi bạn thực hiện một giao dịch?
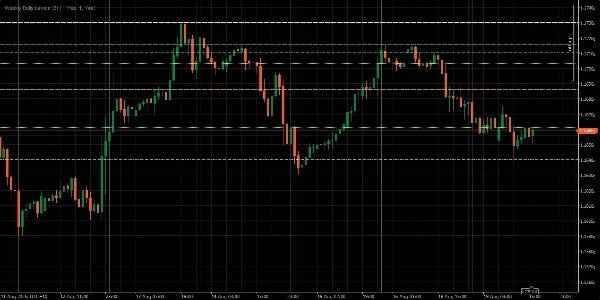
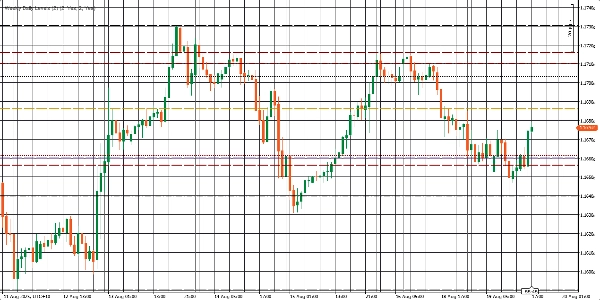
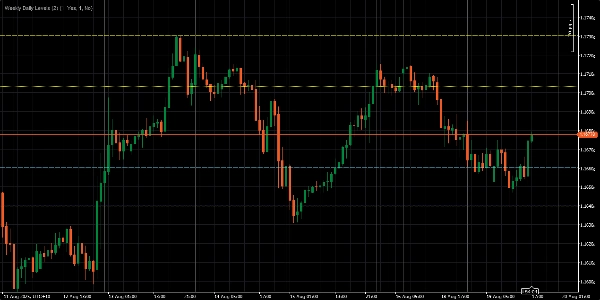
The Weekly Daily Levels Indicator sẽ làm phần việc nặng nhọc cho bạn. Nó tự động vẽ giá mở cửa, cao, thấp, đóng cửa (OHLC) và giá điểm giữa của ngày trước và tuần trước trực tiếp trên biểu đồ của bạn. Điều này có nghĩa là bạn có thể tập trung vào việc thực hiện chiến lược của mình trong khi chỉ báo lo liệu các chi tiết — giúp giao dịch của bạn đơn giản hơn, nhanh hơn và hiệu quả hơn nhiều.
Các Tính Năng Chính:
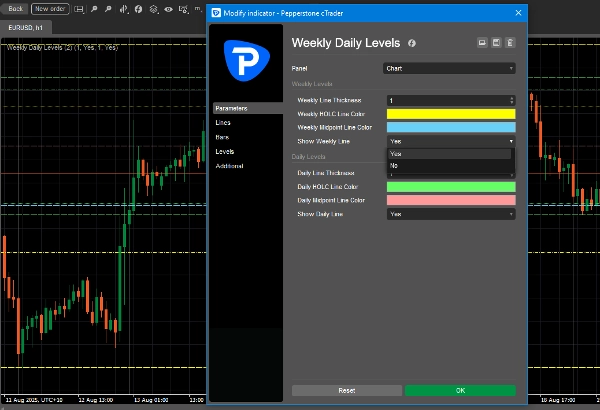
- Hiển thị ngay lập tức giá OHLC và giá điểm giữa hàng ngày và hàng tuần.
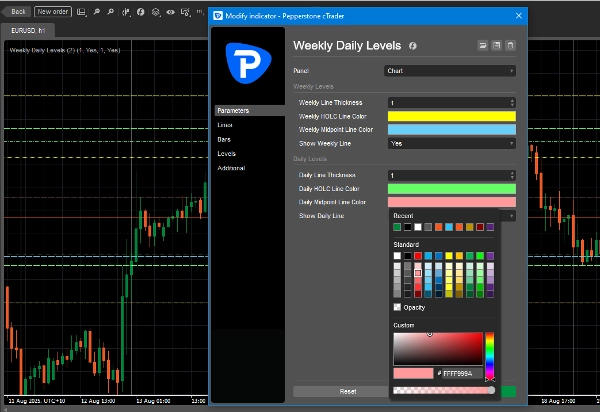
- Tùy chỉnh màu đường để phù hợp với phong cách biểu đồ của bạn.
- Bật hoặc tắt các mức hàng ngày hoặc hàng tuần chỉ với một cú nhấp chuột.
- Điều chỉnh độ dày đường để dễ nhìn hơn.
Tóm tắt
Tóm tắt AI
The Weekly Daily Levels indicator automatically plots the previous day’s and previous week’s open, high, low, close (OHLC) prices along with their mid-points directly on trading charts. It provides instant visual reference to these key price levels, helping traders incorporate daily and weekly price data into their strategies without manual marking. Users can customize line colors and thickness to fit their chart style and toggle daily or weekly levels on or off with a single click. This indicator streamlines the process of tracking important historical price levels for improved trading efficiency.
Hồ sơ chỉ báo
Đánh giá của khách hàng
5.0
Đánh giá: 2
5 | 100 % | |
4 | 0 % | |
3 | 0 % | |
2 | 0 % | |
1 | 0 % |
Đánh giá của khách hàng
August 28, 2025
Not bad if the rules are already clear. Two timeframes give more context.
August 21, 2025
the good surprise is the setup needs less second guessing, and It works better with a written plan.
Thảo luận
Câu hỏi thường gặp
Các sản phẩm có sẵn trên cTrader Store, bao gồm bot giao dịch, chỉ báo và plugin, được cung cấp bởi các nhà phát triển bên thứ ba và chỉ nhằm mục đích cung cấp thông tin và tiếp cận kỹ thuật. cTrader Store không phải là nhà môi giới và không cung cấp lời khuyên đầu tư, khuyến nghị cá nhân hay bất kỳ đảm bảo nào về hiệu suất trong tương lai.


Giá
Kể từ 19/04/2025
2
Lượt bán