
Mô tả
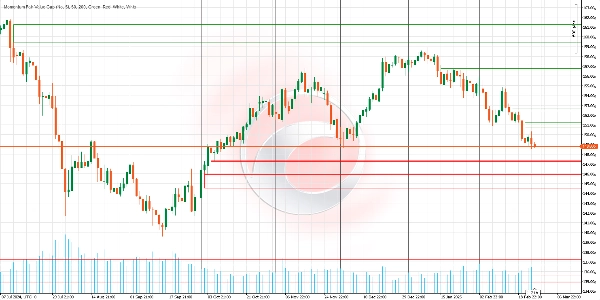
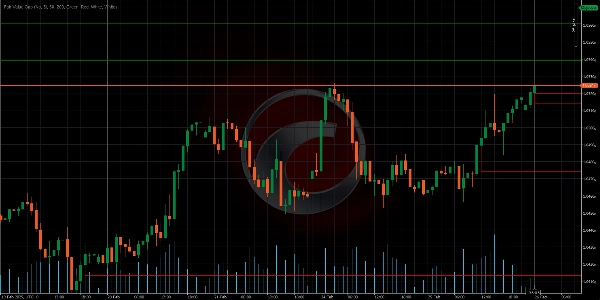
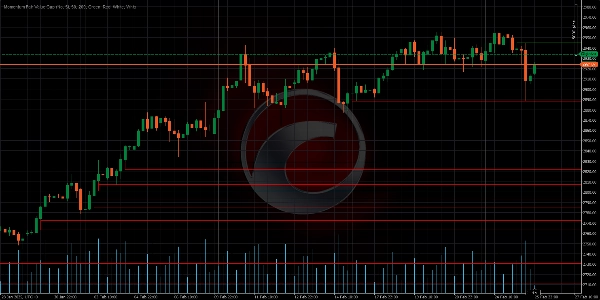
Nó xác định các khu vực mất cân bằng thị trường (Khoảng trống Giá trị Công bằng hoặc FVGs) và chiếu chúng lên biểu đồ một cách thông minh. Khác với các chỉ báo khác, chỉ báo này thích ứng theo thời gian thực với hành động giá, điều chỉnh kích thước, độ bền và mức độ liên quan của nó. Nó lý tưởng cho các nhà giao dịch tìm kiếm mục tiêu rõ ràng và quản lý khoảng trống trực quan nâng cao.
✨ TÍNH NĂNG CHÍNH
- Điều chỉnh Khoảng trống Động
Logic: Nếu giá chạm một phần vào FVG (ví dụ, chạm nhẹ ranh giới dưới), chỉ báo tự động thay đổi kích thước khoảng trống để chỉ phản ánh khu vực chưa được phủ.
Lợi ích: Tránh tín hiệu giả và giữ chỉ những khoảng trống có tiềm năng thực sự hoạt động. - Điểm Giữa Điền Đầy
Logic: Vẽ một đường ở trung tâm của khoảng trống. Nếu giá chạm vào đó, FVG được coi là "đã được điền đầy" và có thể bị loại bỏ (có thể cấu hình).
Lợi ích: Chỉ yêu cầu tiếp xúc 50% để xác nhận đóng cửa, lọc nhiễu và giao dịch sớm. - Chiếu Dự Bất Tận Cho Đến Khi Được Điền Đầy
Logic: Các khoảng trống kéo dài vô thời hạn vào tương lai (chúng không biến mất sau X cây nến).
Lợi ích: Cung cấp tham chiếu liên tục cho đến khi thị trường giải quyết mất cân bằng. - Tự Động Dọn Dẹp Các Khoảng Trống Không Hợp Lệ
Logic: Tự động loại bỏ các khoảng trống cũ khi chúng được điền đầy hoàn toàn.
Lợi ích: Giữ cho biểu đồ sạch sẽ và tập trung vào các vùng hoạt động. - Tùy Chỉnh Trực Quan Nâng Cao
Tùy chọn: Màu sắc khác nhau cho khoảng trống tăng (xanh lá) và giảm (đỏ). Điều chỉnh độ trong suốt để tránh làm rối biểu đồ.
Lợi ích: Thích ứng với bất kỳ phong cách giao dịch hoặc chiến lược trực quan nào.
🎯 CÁCH SỬ DỤNG NÓ TRONG GIAO DỊCH?
Xác định Các Vùng Quan Trọng:
- FVG Tăng (Xanh lá): Khu vực nơi người mua tạm thời mất sức mạnh.
→ Chiến lược: Tìm cơ hội mua trong các đợt hồi về vùng này. - FVG Giảm (Đỏ): Khu vực nơi người bán bị vượt qua.
→ Chiến lược: Tìm cơ hội bán trong các đợt tăng giá đến vùng này.
Tương tác với Giá:
- Nếu khoảng trống điều chỉnh động (giảm kích thước), điều đó cho thấy thị trường đang thử nghiệm vùng nhưng chưa có xác nhận.
- Nếu khoảng trống bị loại bỏ (bằng cách điền đầy hoàn toàn hoặc Điểm Giữa), xem như mất cân bằng đã được sửa chữa.
🔍 XÁC NHẬN VỚI CÁC CÔNG CỤ KHÁC
Kết hợp FVG với các mức hỗ trợ/kháng cự, khối lượng hoặc RSI để lọc tín hiệu.
📋 SO SÁNH TÍNH NĂNG
___________________________________________________________________________________
Tính năng Momentum Fair Value Gap Traditional Indicators
________________________________________________________________________________
Độ bền---------------- Kéo dài khoảng trống cho đến khi điền đầy ----------------------- Biến mất sau X cây nến
Độ chính xác đóng-------- Tùy chọn xác nhận 50% --------------------- Yêu cầu điền đầy khoảng trống hoàn toàn
Tính linh hoạt ------------------ Thay đổi kích thước theo giá ------------------------- Mức tĩnh và không thay đổi
Tập trung trực quan---------------- Loại bỏ các khoảng trống không liên quan ----------------------- Làm rối biểu đồ với dữ liệu quá khứ
📝 VÍ DỤ THỰC TẾ
Kịch bản trên EURUSD (1H):
Một FVG Tăng (màu xanh lá) hình thành sau một cây nến giảm mạnh. Vài ngày sau, giá hồi lại, chạm ranh giới dưới của khoảng trống nhưng không điền đầy nó. Chỉ báo tự động giảm kích thước khoảng trống. Cuối cùng, giá chạm Điểm Giữa (đường trung tâm), kích hoạt việc loại bỏ nó. Nhà giao dịch vào lệnh bán sau khi xác nhận sự từ chối tại vùng này.
Chỉ báo Ctrader Store:
Dynamic Market Structure
Analysis of Turning Points
Fibonacci Linear
Regression Multi-timeframe
Multi-Level Candle Bias
Tracker
Auto Support and
Resistance Trend Lines
Tóm tắt
Key features include:
- Dynamic Gap Adjustment: Automatically resizes gaps when price partially touches them, reducing false signals.
- MidPoint Fill: Marks the gap centerline; if price touches it, the gap is considered filled and can be removed, requiring only 50% contact for confirmation.
- Infinite Projection: Gaps extend indefinitely until filled, maintaining persistent market imbalance references.
- Automatic Cleanup: Removes fully filled gaps to keep charts focused on active zones.
- Advanced Visual Customization: Uses distinct colors for bullish (green) and bearish (red) gaps with adjustable transparency.
In trading, bullish FVGs indicate zones where buyers lost strength, suggesting buying opportunities on pullbacks; bearish FVGs mark where sellers were overtaken, indicating selling opportunities on rallies. The indicator’s dynamic interaction with price helps confirm market imbalance resolution.
It is recommended to combine this indicator with other tools like support/resistance levels, volume, or RSI for signal filtering.
Đánh giá của khách hàng
5 | 0 % | |
4 | 100 % | |
3 | 0 % | |
2 | 0 % | |
1 | 0 % |


