
Fractals
Chỉ báo
2 lượt mua
Phiên bản 1.0, Aug 2025
Windows, Mac
4.0
Đánh giá: 2
Mô tả
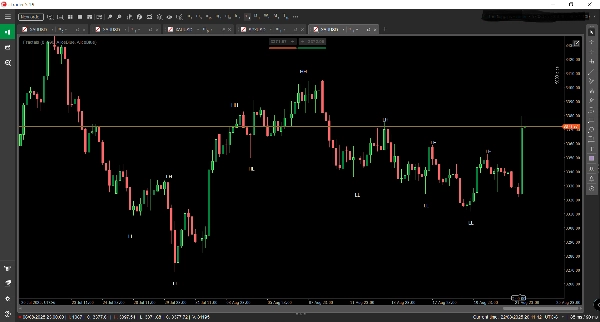
🧠 Fractals – Cấu trúc Thị trường được Hiển thị
Fractals là một chỉ báo giao dịch được thiết kế chính xác cho cTrader giúp tiết lộ kiến trúc ẩn của hành động giá. Bằng cách tự động phát hiện và gắn nhãn Đỉnh Cao Hơn (HH), Đáy Cao Hơn (HL), Đỉnh Thấp Hơn (LH), và Đáy Thấp Hơn (LL) trực tiếp trên biểu đồ, Fractals biến dữ liệu giá thô thành một bản đồ cấu trúc thị trường rõ ràng và có thể hành động.
🔍 Các Tính Năng Chính:
- Bản Đồ Cấu Trúc Thời Gian Thực: Nhận diện ngay lập tức các điểm dao động và gắn nhãn chúng để tiết lộ hướng xu hướng và vùng đảo chiều.
- Nhận Thức Đa Khung Thời Gian: Được thiết kế để làm nổi bật cấu trúc vĩ mô trên các khung thời gian cao hơn, giúp nhà giao dịch có lợi thế chiến lược trong việc căn chỉnh điểm vào với các xu hướng chi phối.
- Tối Ưu Hóa Theo Xu Hướng: Lý tưởng cho các nhà giao dịch sử dụng chiến lược động lượng, phá vỡ, hoặc hồi lại, giúp xác nhận xu hướng và tránh các bẫy ngược xu hướng.
- Lớp Phủ Hình Ảnh Sạch Sẽ: Các chú thích biểu đồ tinh tế tích hợp liền mạch với bất kỳ thiết lập giao dịch nào, nâng cao sự rõ ràng mà không gây rối mắt.
🧭 Các Trường Hợp Sử Dụng:
- Phát hiện các xu hướng mới nổi và sự thay đổi cấu trúc trước khi chúng trở nên rõ ràng.
- Xác thực các thiết lập giao dịch với sự xác nhận cấu trúc.
- Kết hợp với các đường trung bình động, khối lượng, hoặc chỉ báo tùy chỉnh để tạo sự đồng thuận nhiều lớp.
- Hoàn hảo cho kiểm tra lại thủ công và đánh giá công ty prop nơi logic dựa trên cấu trúc là then chốt.
Tóm tắt
Tóm tắt AI
Fractals is a trading indicator designed for the cTrader platform that visualizes market structure by automatically detecting and labeling key price action points: Higher Highs (HH), Higher Lows (HL), Lower Highs (LH), and Lower Lows (LL). It provides real-time mapping of swing points to reveal trend direction and potential reversal zones. The indicator supports multi-timeframe analysis, emphasizing macro structure on higher timeframes to help align trades with dominant market trends. Fractals is optimized for momentum, breakout, and pullback strategies, assisting traders in confirming bias and avoiding counter-trend trades. Its clean visual overlay integrates smoothly with existing chart setups, enhancing clarity without clutter. Use cases include spotting emerging trends and structural shifts early, validating trade setups with structural confirmation, combining with other indicators like moving averages or volume for layered analysis, and supporting manual backtesting and prop firm evaluations where market structure is critical. The indicator applies across various markets including Forex, indices, commodities, cryptocurrencies, and stocks.
Hồ sơ chỉ báo
Đánh giá của khách hàng
4.0
Đánh giá: 2
5 | 0 % | |
4 | 100 % | |
3 | 0 % | |
2 | 0 % | |
1 | 0 % |
Đánh giá của khách hàng
August 31, 2025
it gives the trade idea another check, but the result needs a journal.
August 27, 2025
Thảo luận
Câu hỏi thường gặp
Prop
Forex
Indices
Commodities
Crypto
Stocks
Các sản phẩm có sẵn trên cTrader Store, bao gồm bot giao dịch, chỉ báo và plugin, được cung cấp bởi các nhà phát triển bên thứ ba và chỉ nhằm mục đích cung cấp thông tin và tiếp cận kỹ thuật. cTrader Store không phải là nhà môi giới và không cung cấp lời khuyên đầu tư, khuyến nghị cá nhân hay bất kỳ đảm bảo nào về hiệu suất trong tương lai.


Giá
26
Lượt bán
2.18K
Cài đặt miễn phí