Mô tả
📈 Chỉ báo AutoFibRetracement
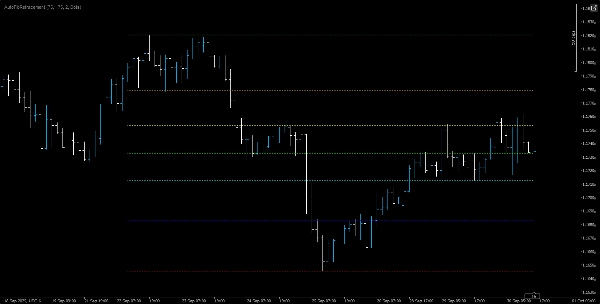
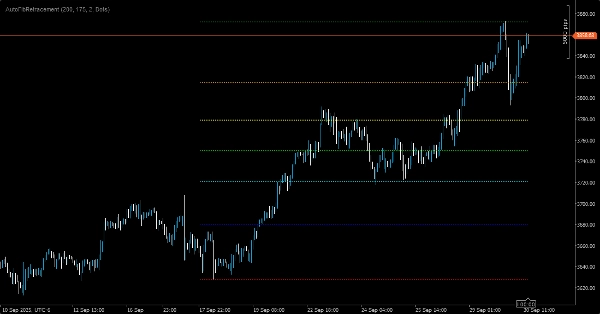
Chỉ báo AutoFibRetracement là một công cụ phủ mạnh mẽ được thiết kế để tự động vẽ các mức thoái lui Fibonacci dựa trên các biến động giá gần đây. Lý tưởng cho các nhà giao dịch muốn xác định các vùng hỗ trợ và kháng cự tiềm năng, chỉ báo này tính toán động các mức thoái lui bằng cách sử dụng các tham số có thể tùy chỉnh và hiển thị trực tiếp trên biểu đồ.
🔧 Tính năng chính:
• Phát hiện biến động tự động: Tính toán các đỉnh và đáy trong một cửa sổ nhìn lại do người dùng định nghĩa.
• Cửa sổ thời kỳ có thể tùy chỉnh: Các nhà giao dịch phải chọn một cửa sổ phù hợp để nắm bắt chính xác các đỉnh và đáy có ý nghĩa. Lựa chọn này rất quan trọng để căn chỉnh các mức thoái lui với cấu trúc thị trường thực tế.
• Các mức Fibonacci: Bao gồm các tỷ lệ tiêu chuẩn — 0%, 23,6%, 38,2%, 50%, 61,8%, 78,6% và 100% — mỗi mức được mã màu để dễ nhìn.
• Tùy chọn kiểu dáng trực quan:
• Độ mờ có thể điều chỉnh (0–255) cho độ trong suốt của đường.
• Độ dày và kiểu đường có thể cấu hình (ví dụ: chấm, liền).
• Hiển thị phủ: Vẽ trực tiếp trên biểu đồ giá để tích hợp liền mạch với các công cụ phân tích kỹ thuật khác.
🎯 Trường hợp sử dụng:
Hoàn hảo cho các nhà giao dịch swing, người theo xu hướng và nhà phân tích kỹ thuật dựa vào các vùng thoái lui Fibonacci để lên kế hoạch vào lệnh, thoát lệnh và mức dừng lỗ. Hiệu quả của chỉ báo này phụ thuộc vào khả năng của nhà giao dịch trong việc chọn kích thước cửa sổ phù hợp — quá ngắn có thể bỏ lỡ các biến động rộng hơn, quá dài có thể làm loãng hành động giá gần đây.