
Mô tả
# Hồ Sơ Khối Lượng Pro – Phân Tích Cấu Trúc Thị Trường Nâng Cao cho cTrader
**Mở khóa những hiểu biết về khối lượng cấp độ tổ chức** với Pro Volume Profile, một chỉ báo hiệu suất cao được thiết kế cho các nhà giao dịch cTrader tìm kiếm độ chính xác trong luồng lệnh, hỗ trợ/kháng cự và các chiến lược phá vỡ. Được xây dựng trên dữ liệu khối lượng tick mạnh mẽ, nó tiết lộ nơi tiền thông minh tích lũy, phân phối và từ chối giá—cung cấp các mức có thể hành động như POC, VAH và VAL với độ linh hoạt vô song.
Dù bạn là người thực hành ICT/SMC, nhà giao dịch trong ngày hay nhà phân tích swing, công cụ này biến hành động giá thô thành **cấu trúc thị trường có thể định lượng**, giúp bạn xác định các điểm vào, ra và đảo chiều có xác suất cao.
---
## Khả Năng Cốt Lõi
Pro Volume Profile kết hợp các chế độ phân tích **cố định và thích ứng** để phù hợp với bất kỳ khung thời gian hoặc chiến lược nào:
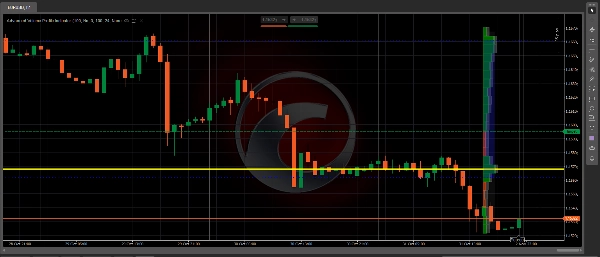
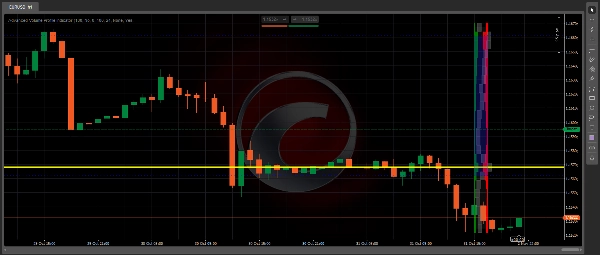
- **Phân Bố Khối Lượng**: Bản đồ hoạt động giao dịch trên các mức giá sử dụng phạm vi thanh đầy đủ (Cao-Thấp) để có hồ sơ chính xác, không bị méo.
- **Delta Mua/Bán**: Các thanh xanh đỏ đặt cạnh nhau làm nổi bật áp lực mua bán tích cực (heuristic 70/30 cho dữ liệu tick forex).
- **Bộ Lọc Phiên**: Tách biệt các phiên NY (13:00–22:00 UTC), London (08:00–17:00), hoặc Châu Á (00:00–09:00)—tập trung vào các khoảng thời gian thanh khoản cao.
- **Phạm Vi Từ Tính**: Tự động điều chỉnh khoảng nhìn lại dựa trên các đỉnh khối lượng gần đây để thích ứng động, theo thời gian thực.
- **Chế Độ Phạm Vi Cố Định**: Người dùng định nghĩa thanh bắt đầu/kết thúc cho phân tích tùy chỉnh (ví dụ: cao/thấp hàng tuần).
- **Vùng Khối Lượng Thấp (LVZ)**: Tự động làm nổi bật các khu vực từ chối (<20% khối lượng tối đa) với màu cam đỏ để phát hiện phá vỡ.
- **POC, VAH/VAL**: Điểm Kiểm Soát + Khu Vực Giá Trị (tùy chỉnh 50–95%) với các đường mở rộng và màu xanh nhạt.
- **Xuất CSV**: Tải xuống giới hạn tốc độ (30 giây chờ) với dấu thời gian, bao gồm Giá, Tổng, khối lượng Mua/Bán.
- **Chế Độ Hiệu Suất**: Chính xác (độ phân giải đầy đủ) hoặc Nhanh (tối ưu cho hơn 1000 thanh) để cân bằng chi tiết và tốc độ.
## Cách Sử Dụng: Ứng Dụng Giao Dịch Đã Được Chứng Minh
**Cài Đặt**: Gắn vào bất kỳ biểu đồ nào (H1/D1 là lý tưởng). Cài đặt mặc định hoạt động ngay; điều chỉnh `NumRows` (24–50) để tăng độ chi tiết.
**Chiến Lược**:
- **Phá Vỡ**: Vào lệnh khi giá từ chối LVZ hoặc phá vỡ VAH/VAL với xác nhận delta.
- **Đảo Chiều**: POC như nam châm—điều chỉnh khi giá di chuyển ra xa trong các phiên khối lượng thấp.
- **Giao Dịch Trong Phạm Vi**: Sử dụng bộ lọc phiên để giao dịch bật lại Khu Vực Giá Trị (ví dụ: mở cửa London).
- **Quy Trình Xuất**: Phân tích CSV trong Excel để kiểm tra lại hoặc tương quan đa khung thời gian.
**Mẹo Chuyên Nghiệp**: Kết hợp với các công cụ Luồng Lệnh hoặc ICT của cTrader để có các thiết lập tỷ lệ thắng trên 80% trên các cặp chính như EURUSD/XAUUSD.
---
## Tại Sao Chọn Pro Volume Profile?
- **Độ Chính Xác Cấp Tổ Chức**: Delta heuristic + phân phối trọng số cạnh tranh với Sierra Chart/Bookmap (với chi phí chỉ bằng 1/10).
- **Nguyên Bản cTrader**: Không trễ, tự động dọn dẹp, tích hợp API đầy đủ—không phụ thuộc bên ngoài.
- **Giá Trị Trọn Đời**: Mua một lần bao gồm cập nhật, không có đăng ký. Bảo đảm hoàn tiền trong 30 ngày.
**Đã kiểm tra trên**: Forex (EURUSD, GBPUSD), Kim loại (XAUUSD), Chỉ số (US30). Tương thích với cTrader 4.8+.
---
*Một lần $49 • Truy cập ngay • Cập nhật trọn đời*
--
*QUAN TRỌNG* Vì các thuật toán tải lên cửa hàng cTrader không cho phép thuật toán có quyền truy cập đầy đủ nên tùy chọn lưu sang csv ở đây đã bị vô hiệu hóa vì nó cần quyền đó để lưu csv.
Tóm tắt
Key features include adaptive and fixed range modes, automatic identification of low volume zones for breakout detection, and customizable Point of Control (POC) and Value Area High/Low (VAH/VAL) levels. Users can export volume data with timestamps in CSV format for further analysis. Performance modes allow balancing between detail and speed, suitable for various timeframes and strategies.
Typical applications include breakout entries confirmed by delta, reversal trades using POC as a magnet, and range trading based on session-specific value areas. The tool is compatible with forex pairs like EURUSD and GBPUSD, metals such as XAUUSD, and indices including US30. It integrates natively with cTrader, providing zero lag and full API support.


![Logo "[Hamster-Coder] Pivot Points MTF"](https://cdn.ctrader.com/image/webp/4c143e5a-309c-40e3-a578-f04d1e133ffa_31159)
![Logo "Smart Money Concepts (SMC) [Iridio Capital]"](https://cdn.ctrader.com/image/webp/28b69fd1-ef54-4bed-9487-07e78e883be4_40934)


