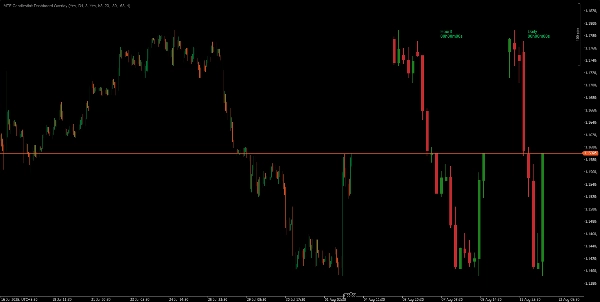
Multi_TF Candlestick Chart Overlay
Chỉ báo
3 lượt mua
Version 1.0, Aug 2025
Windows, Mac
Ảnh "Multi_TF Candlestick Chart Overlay" được tải lên
Kể từ 22/06/2025
39
Lượt bán
35
Cài đặt miễn phí

This indicator overlays bold, easy-to-read candlestick panels from two higher timeframes—fully configurable—directly on your chart. Instantly visualize higher timeframe market structure, trend, and momentum without switching charts.

Features:
• Display two customizable panels (any timeframes) side-by-side
• Real-time countdown timer for each TF’s next candle
• Clean, filled candles with bull/bear coloring and bold wicks
• User controls for panel position, size, spacing, and candle count
• Zero lag, works on any chart timeframe or symbol

Perfect for traders who demand a clear overview of multiple timeframes at a glance.

Never miss a key HTF structure shift again—see the big picture right on your trading chart!


My Other Products


Disclaimer: Trading involves risk, and past results do not guarantee future performance. Use proper risk management, follow stop-loss levels, and trade responsibly. I am not liable for any financial losses from using these algorithms.use these indicators for your confluence and reduce burden your charting markup time

0.0
Đánh giá: 0
Đánh giá của khách hàng
Sản phẩm này chưa có đánh giá nào. Bạn đã dùng thử chưa? Hãy là người đầu tiên chia sẻ với mọi người!
NAS100
NZDUSD
Breakout
XAUUSD
Commodities
Forex
EURUSD
GBPUSD
BTCUSD
SMC
Indices
Prop
Stocks
Crypto
USDJPY

Sản phẩm khác của tác giả này

Tiny_Aim_Trainer
trading stress-relief “mini-game”
Chỉ báo
NAS100
XAUUSD
Commodities
+10
MARKET_STRUCTURE BOS_CHoCH
MarketStructurePro – Smart BOS/CHoCH
Retro_Shooting_Game
trading stress-relief “mini-game”
Chỉ báo
NAS100
Indices
XAUUSD
+4
BSL_SSL_Liqudity
Buy-Side & Sell-Side Liquidity (BSL/SSL) Indicator
Chỉ báo
Indices
Commodities
Forex
Institutional FVG Zones MTF with Confluence
Professional Fair Value Gaps with multitimeframe spot on
Chỉ báo
NAS100
Breakout
XAUUSD
+12
VWAP & Sessions & D,W,M HLO Levels
Killzone Session With VWAP – Precision Meets Price Action
Chỉ báo
NAS100
RSI
Breakout
+12
TDI_Pro
Traders Dynamic Index (TDI) — Divergence Edition
Chỉ báo
NAS100
Indices
Breakout
+6
All-in-One Session Levels Suite
Institutional Session Levels Pro OHLC,Prev(D,W,M OHLC)
Chỉ báo
NAS100
XAUUSD
FVG
+11
Fair Value Gaps_FVG_MTF
Multi-TF FVG + Smart Fibonacci
Market_Session_Forex
Market Sessions
Chỉ báo
NAS100
XAUUSD
Breakout
+14
Market_Profile_Prodessional
Market Profile TPO for cTrader — full auction logic, IB, POC, VA zones, histogram and O/X markers with time
Chỉ báo
NAS100
NZDUSD
XAUUSD
+15
Multi Time Frame Candles FVG Liqudity smc
Multi-Time Frame Candlesticks FVG with BSL/SSL Premium Suite

Bạn cũng có thể thích

Chỉ báo
XAUUSD
Breakout
Forex
+2
McDonalds Pattern-Bzier Curve
Designed to identify and visualize price reversal patterns using Bézier curves.
Master Dragom SR
Indicator,combines with several strategies.MA locate trends,pullback, signal volumes, reversals, support and resistance
Chỉ báo
Grid
RSI
Breakout
+14
StopATR
Displays a dynamic stop loss line based on the Average True Range (ATR), helping traders visualize volatility-based risk
Chỉ báo
Indices
XAUUSD
Forex
Heatmap
heatmap
Chỉ báo
NAS100
XAUUSD
Forex
+3
Linear Regression Oscillator
The Linear Regression Oscillator (LRO) is a technical indicator based on linear regression analysis.
Chỉ báo
Breakout
PDHL
PDHL - Previous Day High&Low
IR Macd on Chart
this indicator show macd on chart.
zh-cn Variety Period clock panel(multilanguage)
This indicator can be used to: change color, shape size, position, change font, increase or decrease, and other function
Chỉ báo
NAS100
NZDUSD
Breakout
+20
MAQuantAdaptivePriceZoneOscillator
MA Quant Adaptive Price Zone Oscillator identifie dynamiquement les zones de prix optimales pour les entrées et sorties.
True Trend H4
It draws a step line that visualize the movement of H4. Particularly effective when trade on lower timeframe.
Chỉ báo
NAS100
XAUUSD
FVG
+6
Fair Value Gaps
The Fair Value Gap (FVG) Indicator identifies inefficiencies in price action where an imbalance occurs due to aggressive
Chỉ báo
Fibonacci
Anchored Moving Average
Anchor a moving average to any point on the chart and watch it extend dynamically as price evolves.
Kể từ 22/06/2025
39
Lượt bán
35
Cài đặt miễn phí