
Mô tả
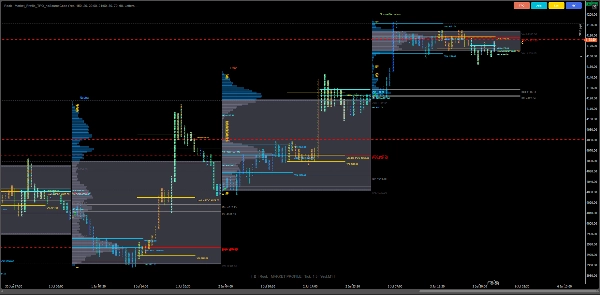
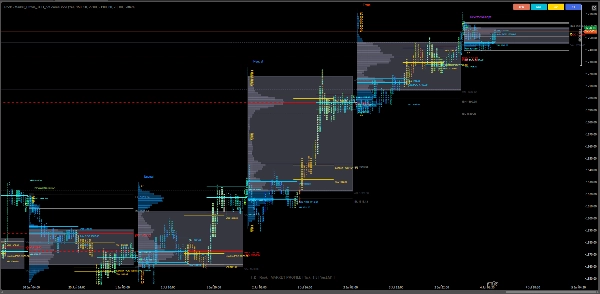
Market Profile TPO (Time Price Opportunity) mang đến hình ảnh cấu trúc thị trường cấp độ tổ chức cho cTrader — cho phép các nhà giao dịch nhìn thấy cách giá, thời gian và khối lượng tương tác qua các phiên trong một cái nhìn thông minh duy nhất.
Được thiết kế cho các nhà giao dịch trong ngày chuyên nghiệp, các nhà phân tích thị trường đấu giá và những người đam mê dòng lệnh, chỉ báo này cung cấp một biểu diễn chân thực của hoạt động thị trường sử dụng các chữ cái TPO, hộp và biểu đồ. Nó giúp bạn xác định các khu vực giá trị, vùng POC, phạm vi cân bằng ban đầu và các mức naked với độ chính xác cao.
⚙️ Các tính năng chính
✅ (TPO) Hình ảnh hóa
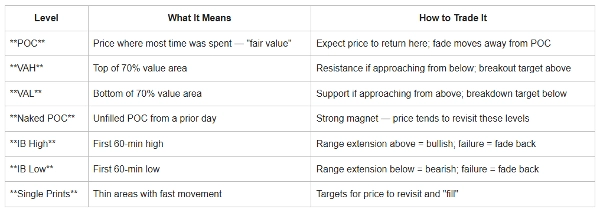
✅ Vùng POC & Giá trị
✅ POC đang phát triển
✅ Phát hiện Cân bằng Ban đầu (IB)
✅ Trí tuệ Phiên & Múi giờ
✅ Chế độ hiển thị TPO (Chữ cái / Biểu đồ)
✅ Đánh dấu Giá Mở/Cửa (O/X)
✅ In đơn & Mức POC/VA Naked
✅ Chồng lớp OHLC Ngày & Ngày Trước
✅ Chồng lớp OHLC Ngày & Ngày Trước
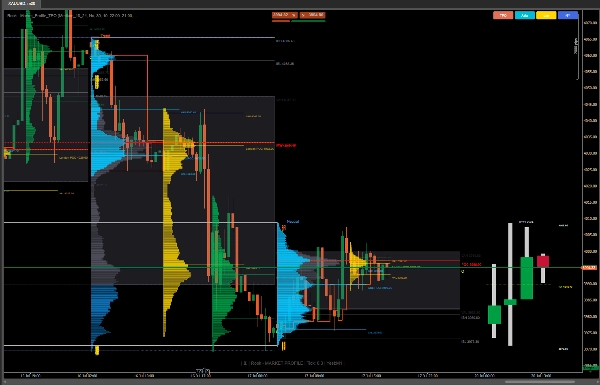
✅ Dự báo Thanh HTF (AMD)
Cải tiến chính
✔ Tải nhanh hơn
✔ Quản lý bộ nhớ tốt hơn
✔ Tính toán Vùng Giá trị chính xác
✔ Định vị hồ sơ phiên chính xác
✔ Hiệu suất chuyển đổi tốt hơn
✔ Tương thích đa nền tảng
✔ Phiên dựa trên UTC (không tự động DST)
✔ Cải thiện xử lý POC naked
✔ Cải thiện hiển thị hồ sơ
🧭 Các trường hợp sử dụng giao dịch
🔹 Phân tích đấu giá trong ngày — Xác định nơi giá trị đang hình thành, di chuyển hoặc phá vỡ.
🔹 Giao dịch đảo chiều POC & Giá trị — Nhắm mục tiêu các lần kiểm tra lại cân bằng hoặc giảm dần các cực đoan.
🔹 Phá vỡ Cân bằng Ban đầu — Phát hiện khi phiên mở rộng vượt ra ngoài phạm vi giờ đầu tiên.
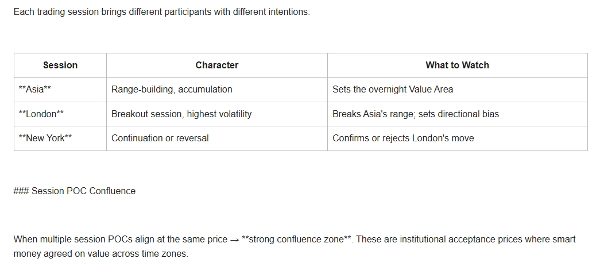
🔹 Nghiên cứu xoay phiên — So sánh hồ sơ giữa các phiên Châu Á, London và New York với căn chỉnh múi giờ.
🔹 Xây dựng bối cảnh tổ chức — Kết hợp với công cụ khối lượng hoặc delta để xác thực dấu chân tiền thông minh.
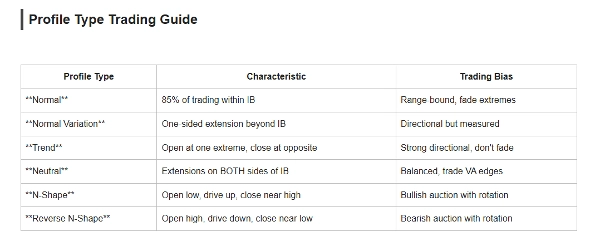
Các loại hồ sơ
Loại Điều kiện thị trường
Bình thường Thị trường cân bằng
Biến thể bình thường Xu hướng vừa phải
Xu hướng Ngày có hướng mạnh
Trung lập Đấu giá hai chiều
Đấu giá tăng hình chữ N
Đấu giá giảm hình chữ N ngược
Phù hợp cho
- Lý thuyết Thị trường Đấu giá (AMT)
- Nhà giao dịch Market Profile
- Nhà giao dịch trong ngày
- Nhà giao dịch Swing
- Nhà giao dịch Hợp đồng tương lai
- Nhà giao dịch Forex
- Phân tích Dòng lệnh chuyên nghiệp
Mang lại sự rõ ràng cấp tổ chức cho biểu đồ của bạn.
Chỉ báo Market Profile TPO biến dữ liệu giá thô thành một câu chuyện về giá trị, mất cân bằng và cơ hội
Tuyên bố từ chối trách nhiệm: Chỉ báo này được cung cấp chỉ nhằm mục đích giáo dục và thông tin và không cấu thành lời khuyên tài chính, đầu tư hoặc giao dịch. Market Profile là một công cụ phân tích và không đảm bảo lợi nhuận hay kết quả trong tương lai.
Giao dịch trên thị trường tài chính có rủi ro đáng kể, và hiệu suất trong quá khứ không đảm bảo kết quả trong tương lai. Người dùng hoàn toàn chịu trách nhiệm về các quyết định giao dịch, quản lý rủi ro và bất kỳ lợi nhuận hoặc thua lỗ phát sinh nào.
Luôn thực hiện phân tích của riêng bạn và tham khảo ý kiến chuyên gia tài chính có trình độ trước khi đưa ra quyết định đầu tư hoặc giao dịch.
Tóm tắt
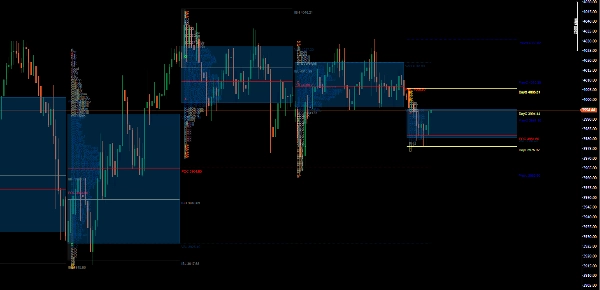
Key features include multiple TPO display modes (letters and histogram), session and timezone intelligence with UTC-based sessions, open/close price markers (O/X), single prints, naked POC/VA levels, and overlays of day and previous day OHLC data. The indicator supports analysis of various market conditions through profile types like Normal (balanced market), Normal Variation (moderate trend), Trend (strong directional day), Neutral (two-sided auction), N-Shape (bullish auction), and Reverse N-Shape (bearish auction).
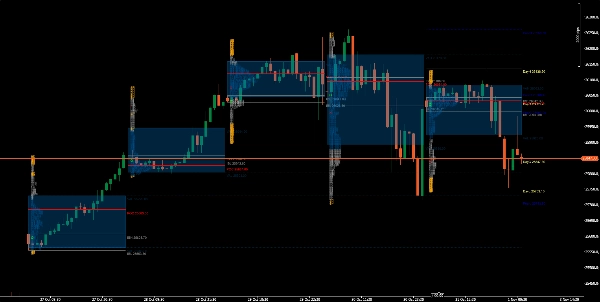
It is suitable for professional day traders, auction market analysts, order flow enthusiasts, and traders across Forex, indices, and commodities markets. Typical use cases include intraday auction analysis, POC and value reversion trades, initial balance breakouts, session rotation studies, and institutional context building when combined with volume or delta tools.
This indicator provides a detailed, structured view of market dynamics to support informed trading decisions based on Auction Market Theory and Market Profile principles.
Đánh giá của khách hàng
5 | 0 % | |
4 | 100 % | |
3 | 0 % | |
2 | 0 % | |
1 | 0 % |


![Logo "Gaussian Channel [Iridio Capital]"](https://cdn.ctrader.com/image/webp/7c039209-5573-4a54-a072-f9528b503103_41960)

![Logo "[Stellar Strategies] MARSI Signal Plotter"](https://cdn.ctrader.com/image/webp/7b2b8da6-8f8e-4646-8d4a-4710c516c01e_25567)


