


Description
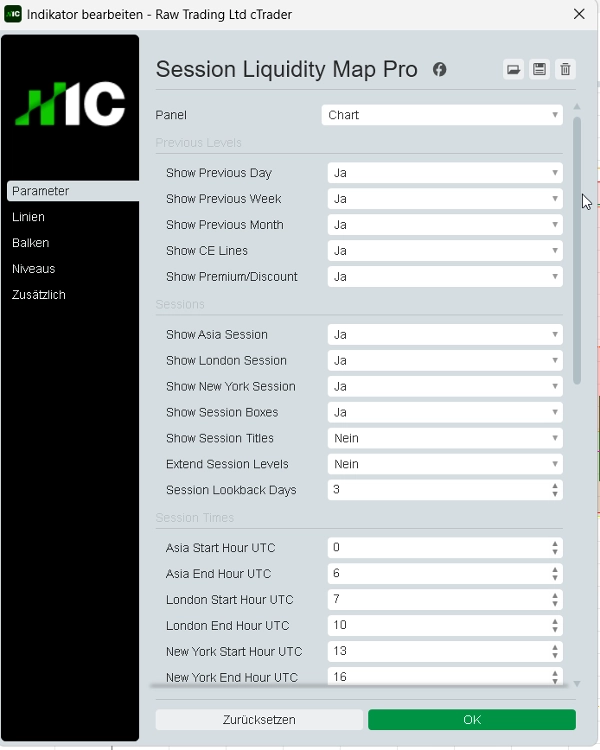
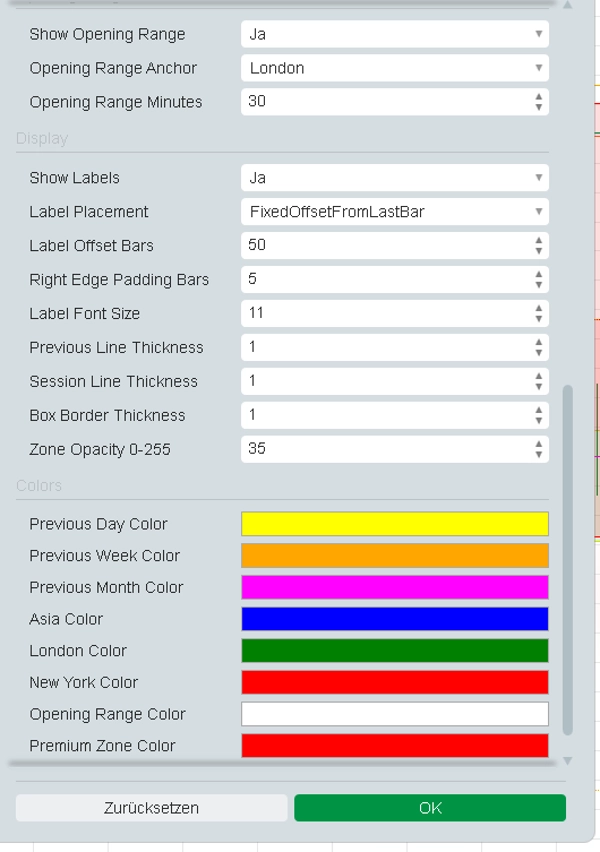
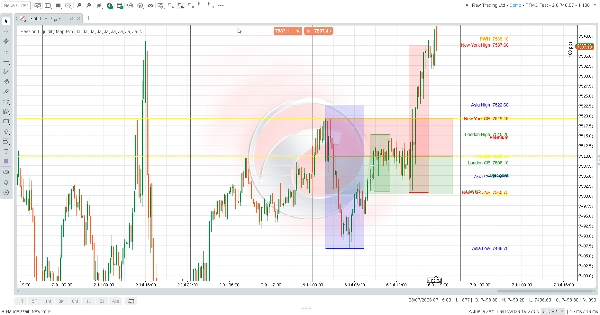
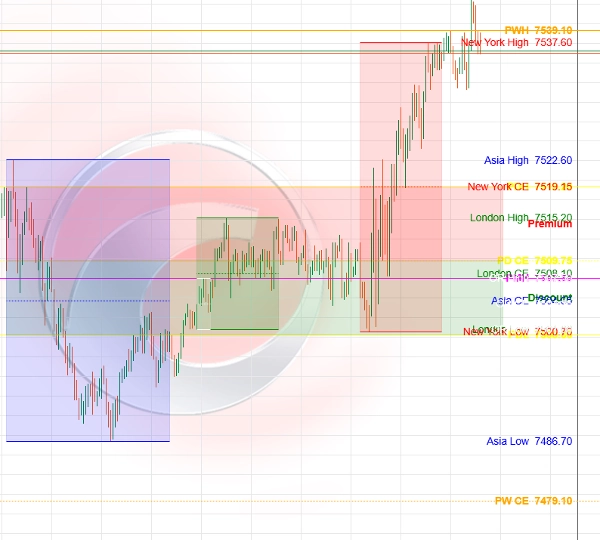
Session Liquidity Map Pro est un indicateur visuel cTrader pour l'analyse structurée de l'action des prix. Il affiche automatiquement les plus hauts/bas des jours, semaines et mois précédents avec les niveaux d'équilibre, les plages des sessions Asie/Londres/New York, les niveaux de la plage d'ouverture et les zones de prime/remise.
L'indicateur est conçu pour la préparation des graphiques, l'analyse basée sur la liquidité, la revue de la structure du marché et la recherche de backtesting. Il n'exécute pas de transactions, ne fournit pas de signaux d'achat/vente et ne nécessite pas un accès complet.
Le trading comporte des risques. Les performances passées ne garantissent pas les résultats futurs.
Résumé
AI summary
Session Liquidity Map Pro is a visual indicator for the cTrader platform designed to enhance structured price action analysis. It automatically maps key market data on your chart, including previous day, week, and month highs and lows, equilibrium levels, and session ranges for Asia, London, and New York. The indicator also highlights opening range levels and premium/discount zones, aiding in liquidity-based analysis and market structure review.
This tool supports chart preparation and backtesting research by visually presenting critical price levels and zones relevant to market participants. It does not execute trades or provide buy/sell signals and operates without requiring full access permissions. The indicator is categorized under market structure and provides visual outputs to assist traders in identifying liquidity sweeps, market structure shifts, key levels, and premium/discount areas.
Session Liquidity Map Pro is suitable for traders focusing on market structure concepts and price action analysis, offering a comprehensive overview of session dynamics and historical price points to inform trading decisions.
This tool supports chart preparation and backtesting research by visually presenting critical price levels and zones relevant to market participants. It does not execute trades or provide buy/sell signals and operates without requiring full access permissions. The indicator is categorized under market structure and provides visual outputs to assist traders in identifying liquidity sweeps, market structure shifts, key levels, and premium/discount areas.
Session Liquidity Map Pro is suitable for traders focusing on market structure concepts and price action analysis, offering a comprehensive overview of session dynamics and historical price points to inform trading decisions.
Profil de l'indicateur
Catégorie de l'indicateur
Structure du marché (SMC)
Type de résultat
Visualisation
Exigences en matière de données
Barres seulement
Signaux pris en charge
Inversion
Cassure
Puissance de la tendance
Atteinte du niveau
Dépassement de niveau
Écart d'ouverture de session
Avis clients
0.0
Avis : 0
Avis clients
Il n'y a pas encore d'avis sur ce produit. Vous l'avez déjà essayé ? Soyez le premier à en parler aux autres !
Discussion
Questions fréquentes
Premium/Discount
Supertrend
Key Levels
MSS
Liquidity Sweep
Market Structure
Les produits disponibles sur cTrader Store, notamment les bots de trading, les indicateurs et les plug-ins, sont fournis par des développeurs tiers et mis à disposition à titre informatif et à des fins d'accès technique uniquement. cTrader Store n'est pas un courtier et ne fournit aucun conseil en investissement, aucune recommandation personnelle ni aucune garantie quant aux performances futures.
Plus de cet auteur


























Prix
4
Ventes